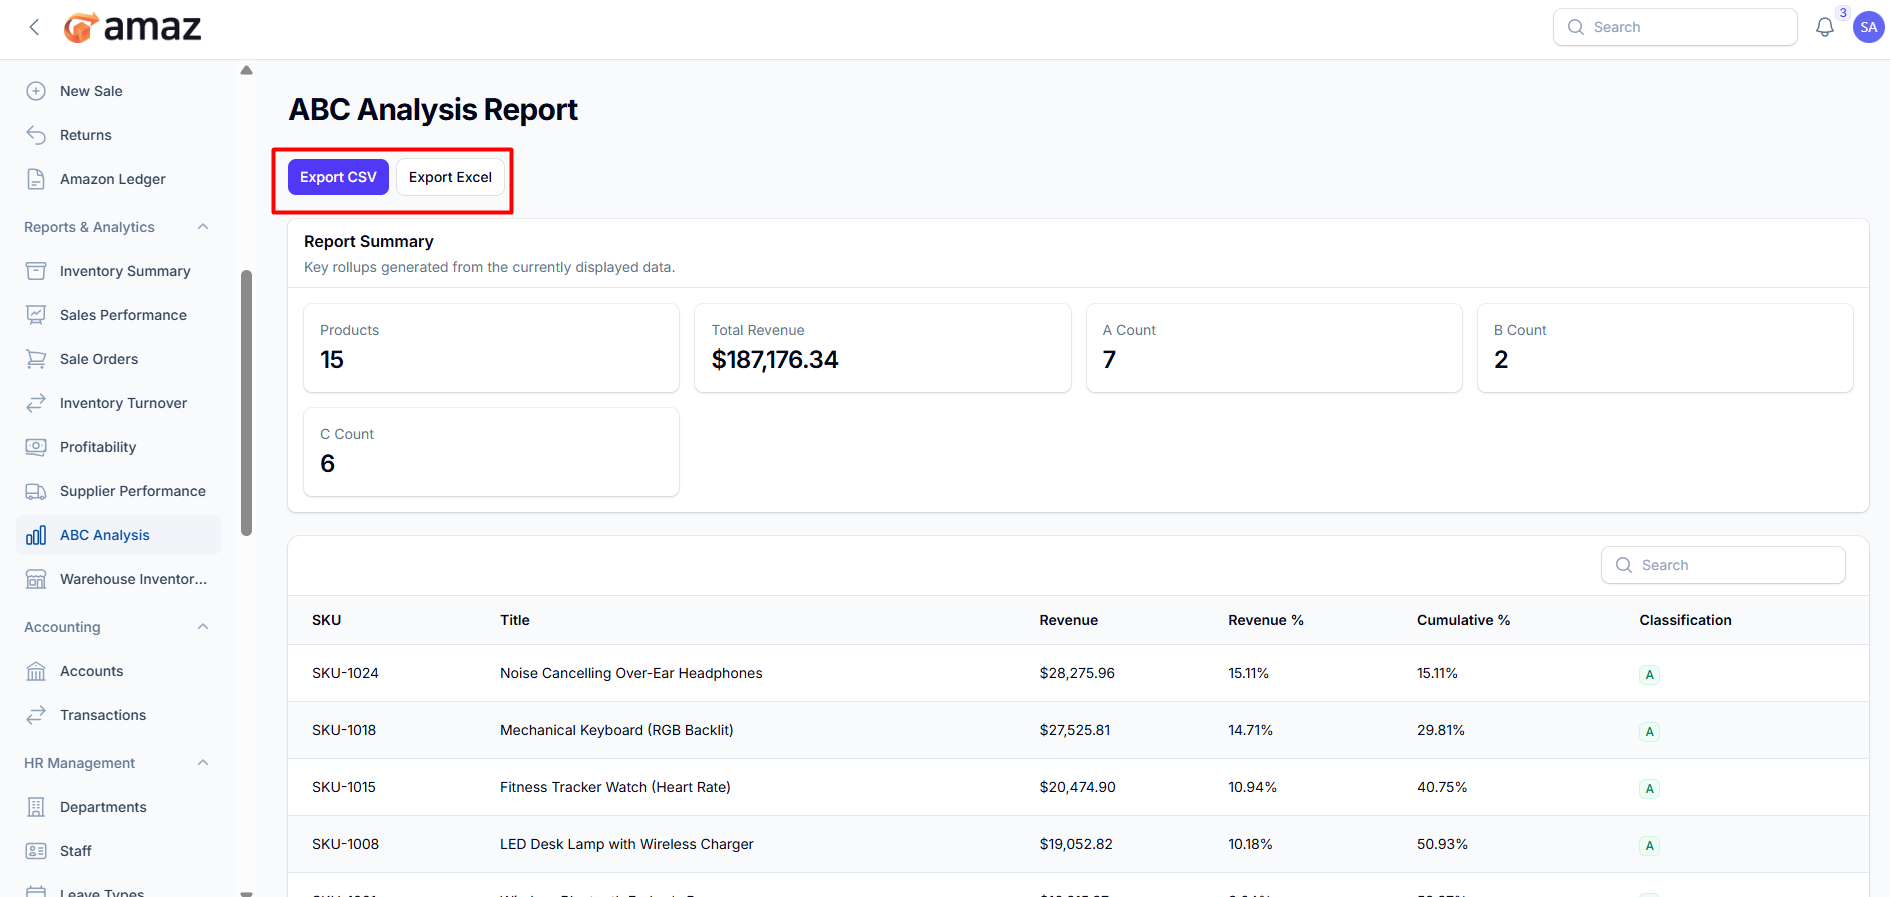
ABC Analysis Report
Classify products by importance based on sales value.
Location: Reports & Analytics → ABC Analysis
Classification:
- A Items — Top 20% products generating 70-80% of revenue
- B Items — Next 30% products generating 15-20% of revenue
- C Items — Remaining 50% products generating 5-10% of revenue
Use For:
- Prioritizing inventory management efforts
- Setting appropriate reorder points
- Warehouse slotting and organization
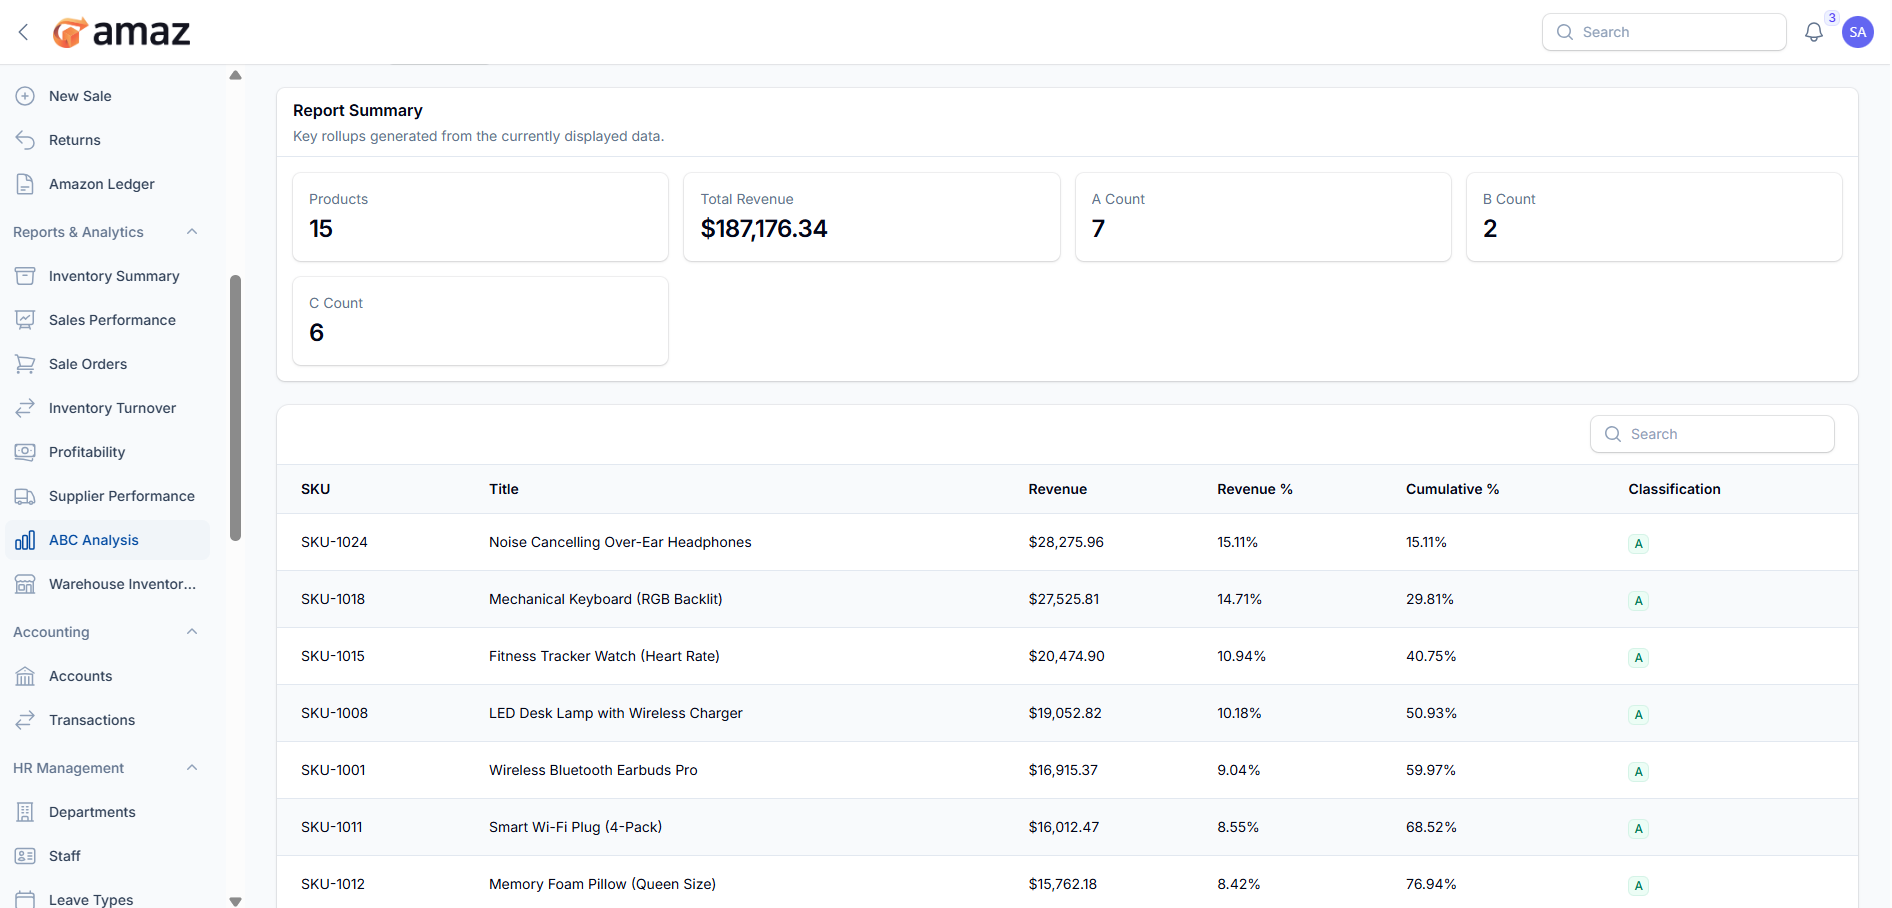
From here you can view the summary of the ABC analysis report.
Field – Description
Products – Total number of products included in the report.
Total Revenue – Total revenue generated by all products.
A Count – Number of high-performing products (top contributors to revenue).
B Count – Number of medium-performing products.
C Count – Number of low-performing products.
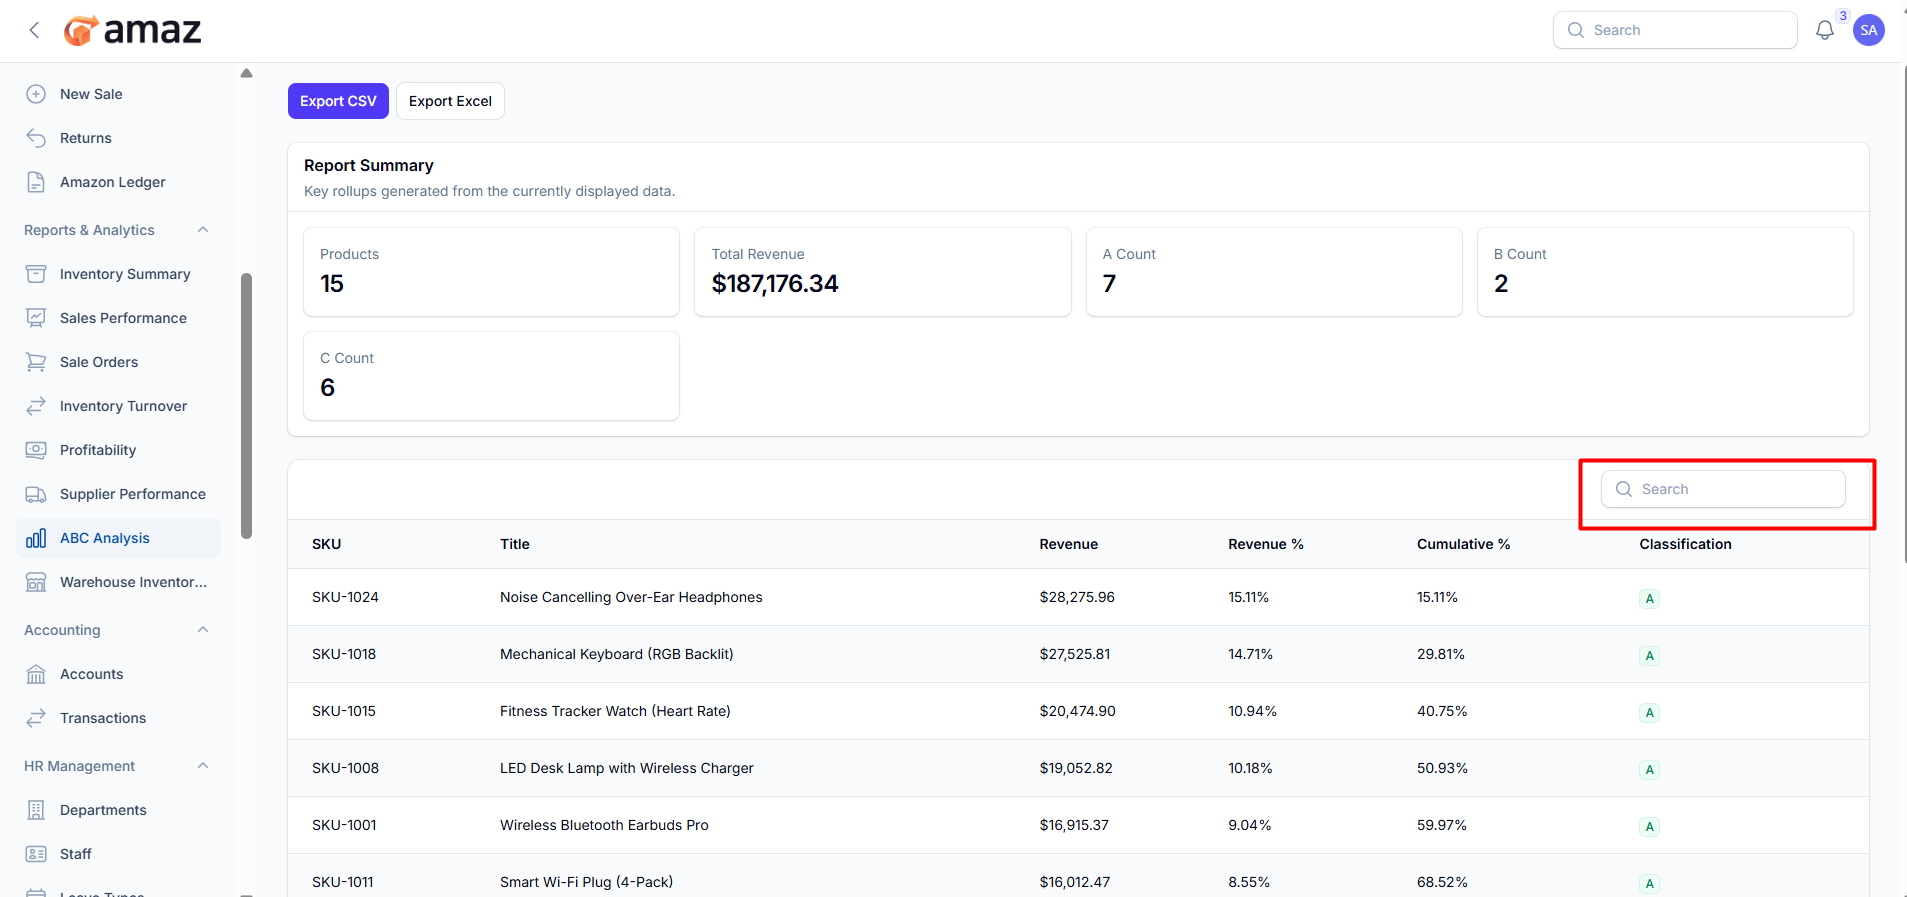
From here you can view the detailed ABC analysis report.
Field – Description
SKU – Unique product SKU.
Title – Product name or title.
Revenue – Total revenue generated by the product.
Revenue % – Percentage contribution of the product to total revenue.
Cumulative % – Cumulative revenue percentage up to that product.
Classification – Product category based on ABC analysis (A, B, or C).
Export CSV – Download the ABC report in CSV format for easy data handling and integration.
Export Excel – Download the ABC report in Excel format for detailed analysis and reporting.
Use the search option to quickly find products in the ABC report by entering SKU or product title.