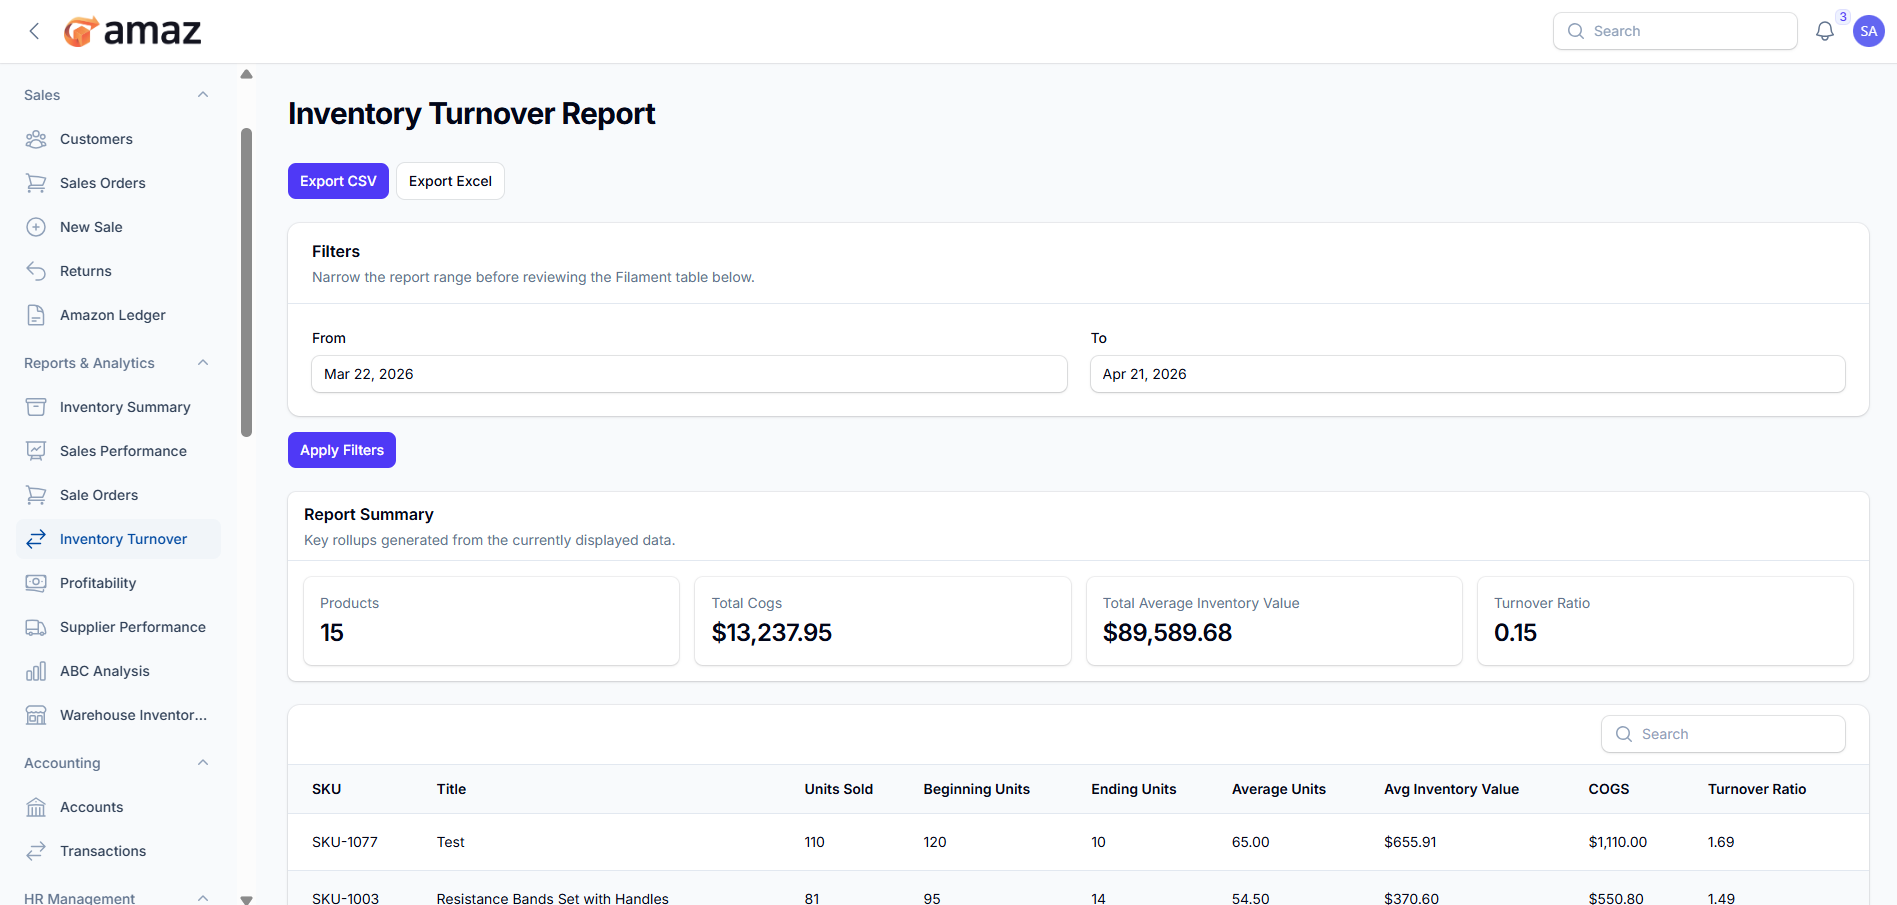
Inventory Turnover Report
Measure how quickly inventory sells.
Location: Reports & Analytics → Inventory Turnover
Metrics Shown:
- Turnover ratio per product
- Days of supply
- Average inventory value
- Cost of goods sold
Identify:
- Slow-moving items (low turnover)
- Fast-moving items (high turnover)
- Dead stock
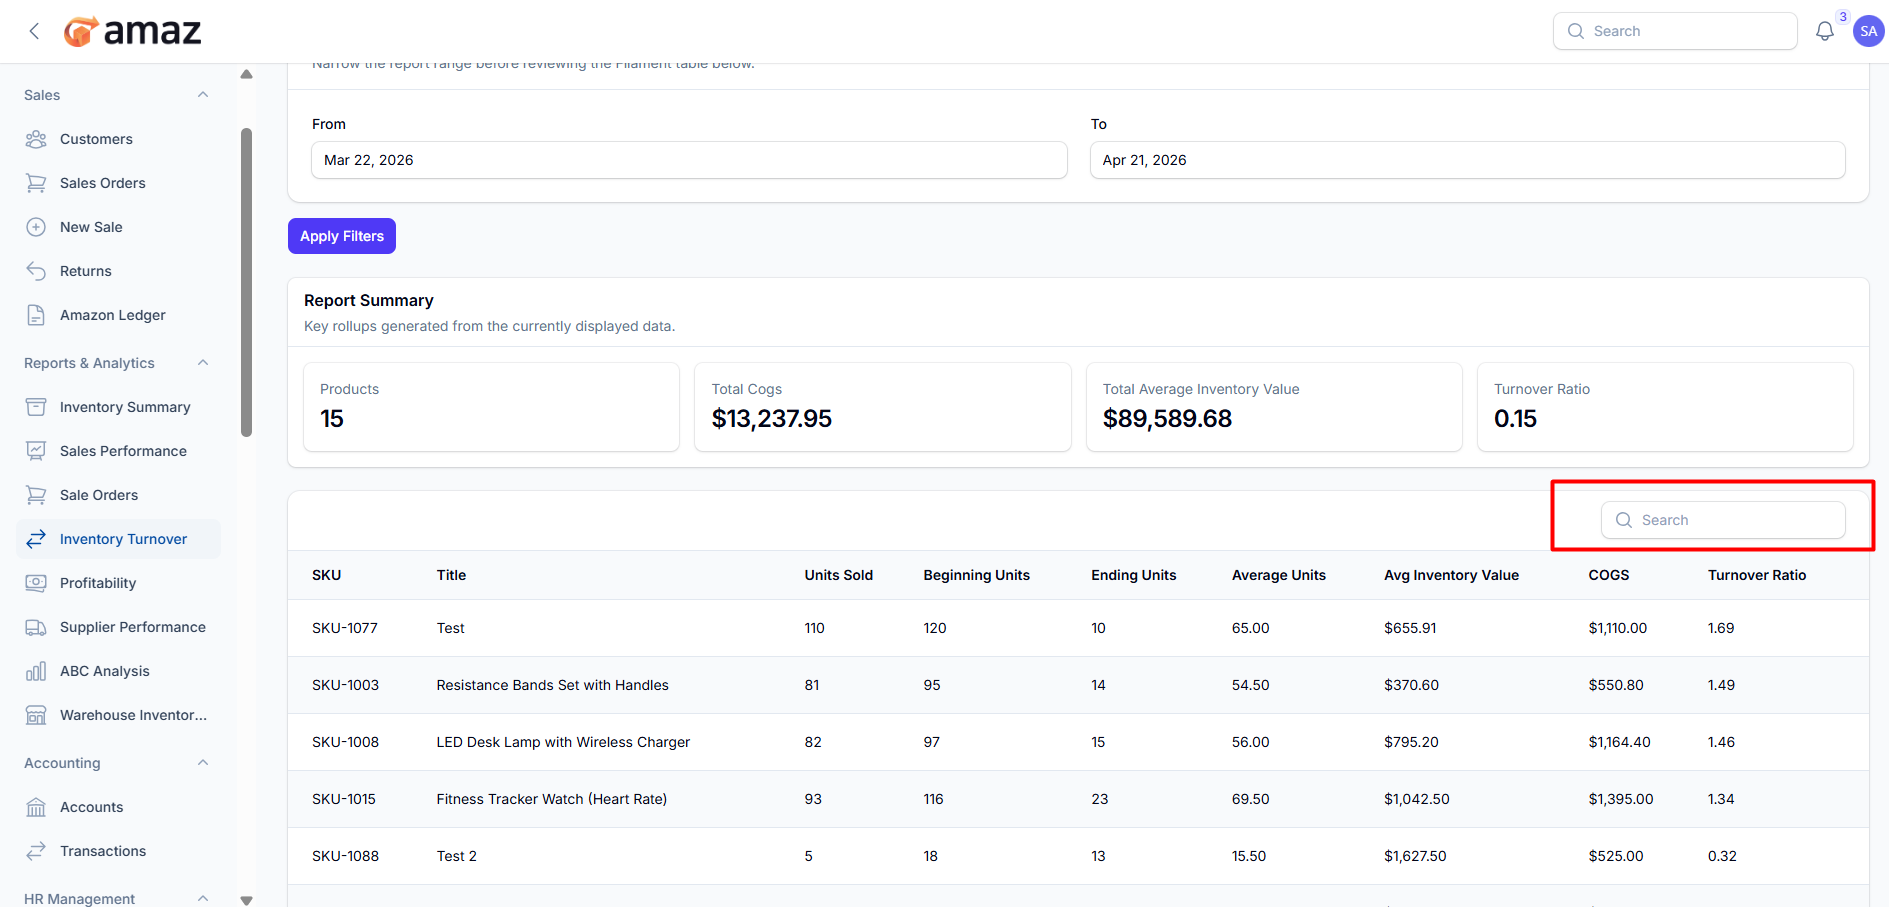
From here you can view the summary of inventory turnover performance.
Field – Description
Products – Total number of products included in the report.
Total COGS – Total cost of goods sold during the selected period.
Total Average Inventory Value – Average value of inventory over the period.
Turnover Ratio – Measure of how often inventory is sold and replaced during the period.
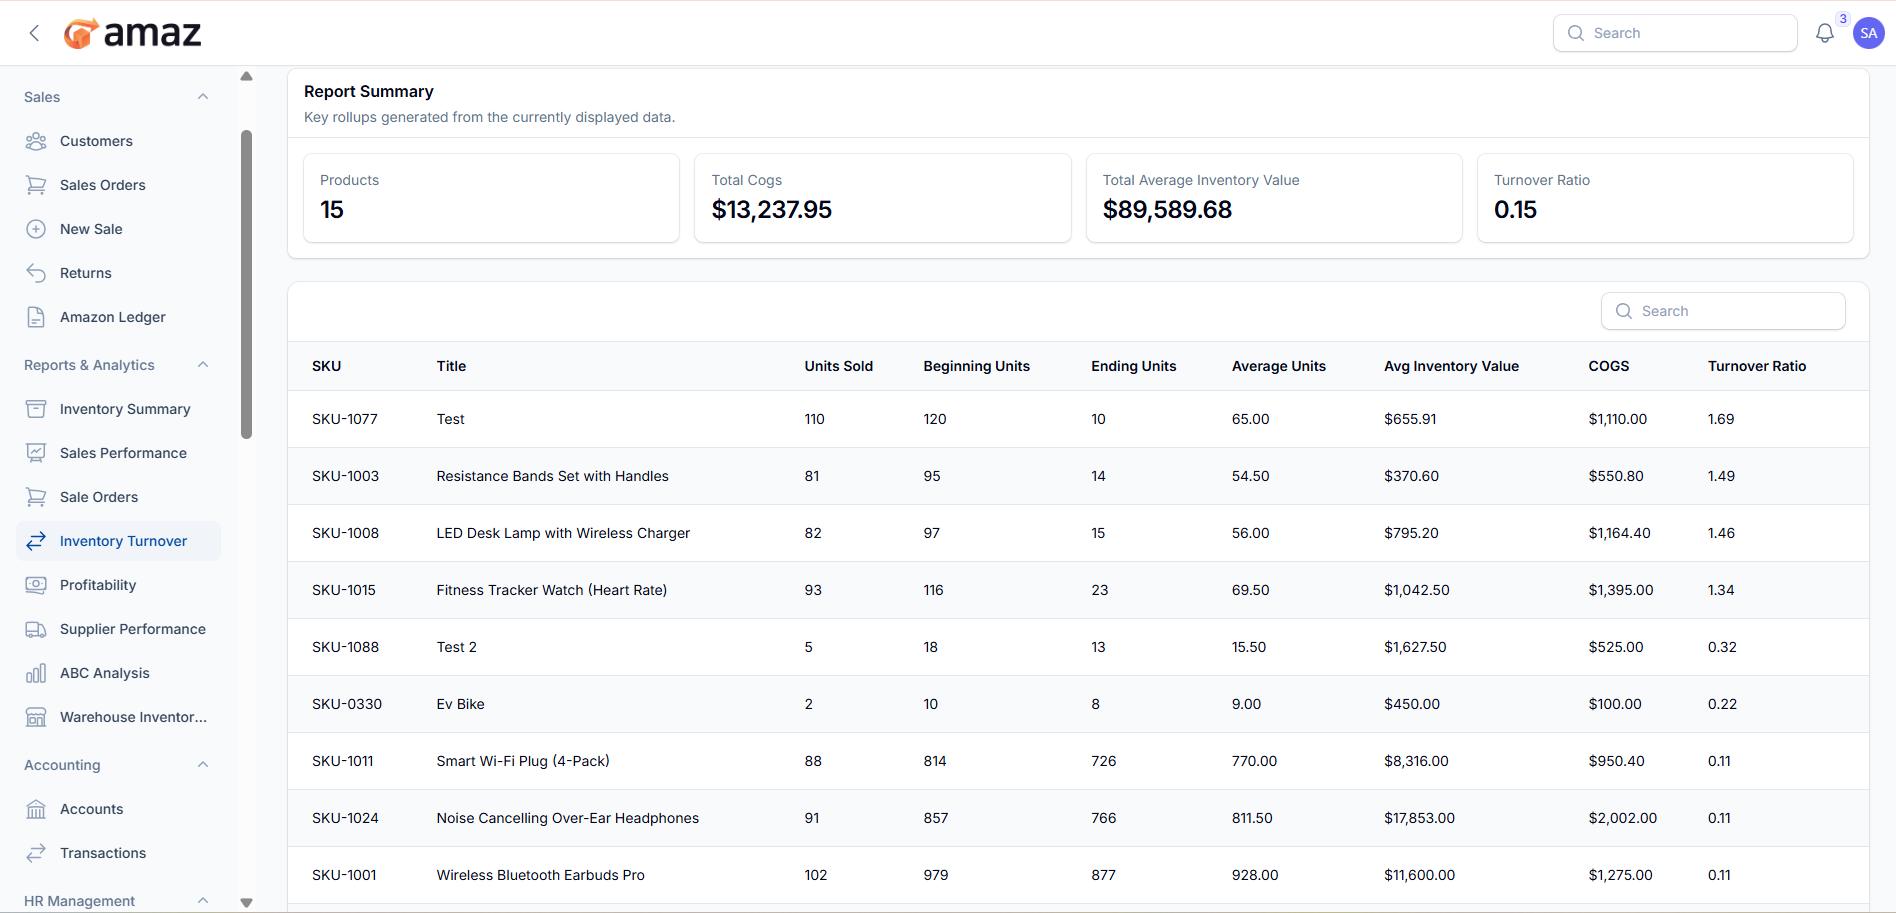
From here you can view the detailed inventory turnover report.
Field – Description
SKU – Unique product SKU.
Title – Product name or title.
Units Sold – Total quantity sold during the period.
Beginning Units – Stock quantity at the start of the period.
Ending Units – Stock quantity at the end of the period.
Average Units – Average stock held during the period.
Avg Inventory Value – Average monetary value of inventory.
COGS – Cost of goods sold for the product.
Turnover Ratio – Number of times the inventory was sold and replaced during the period.
Export CSV – Download the inventory turnover report in CSV format for easy data handling and integration.
Export Excel – Download the inventory turnover report in Excel format for detailed analysis and reporting.
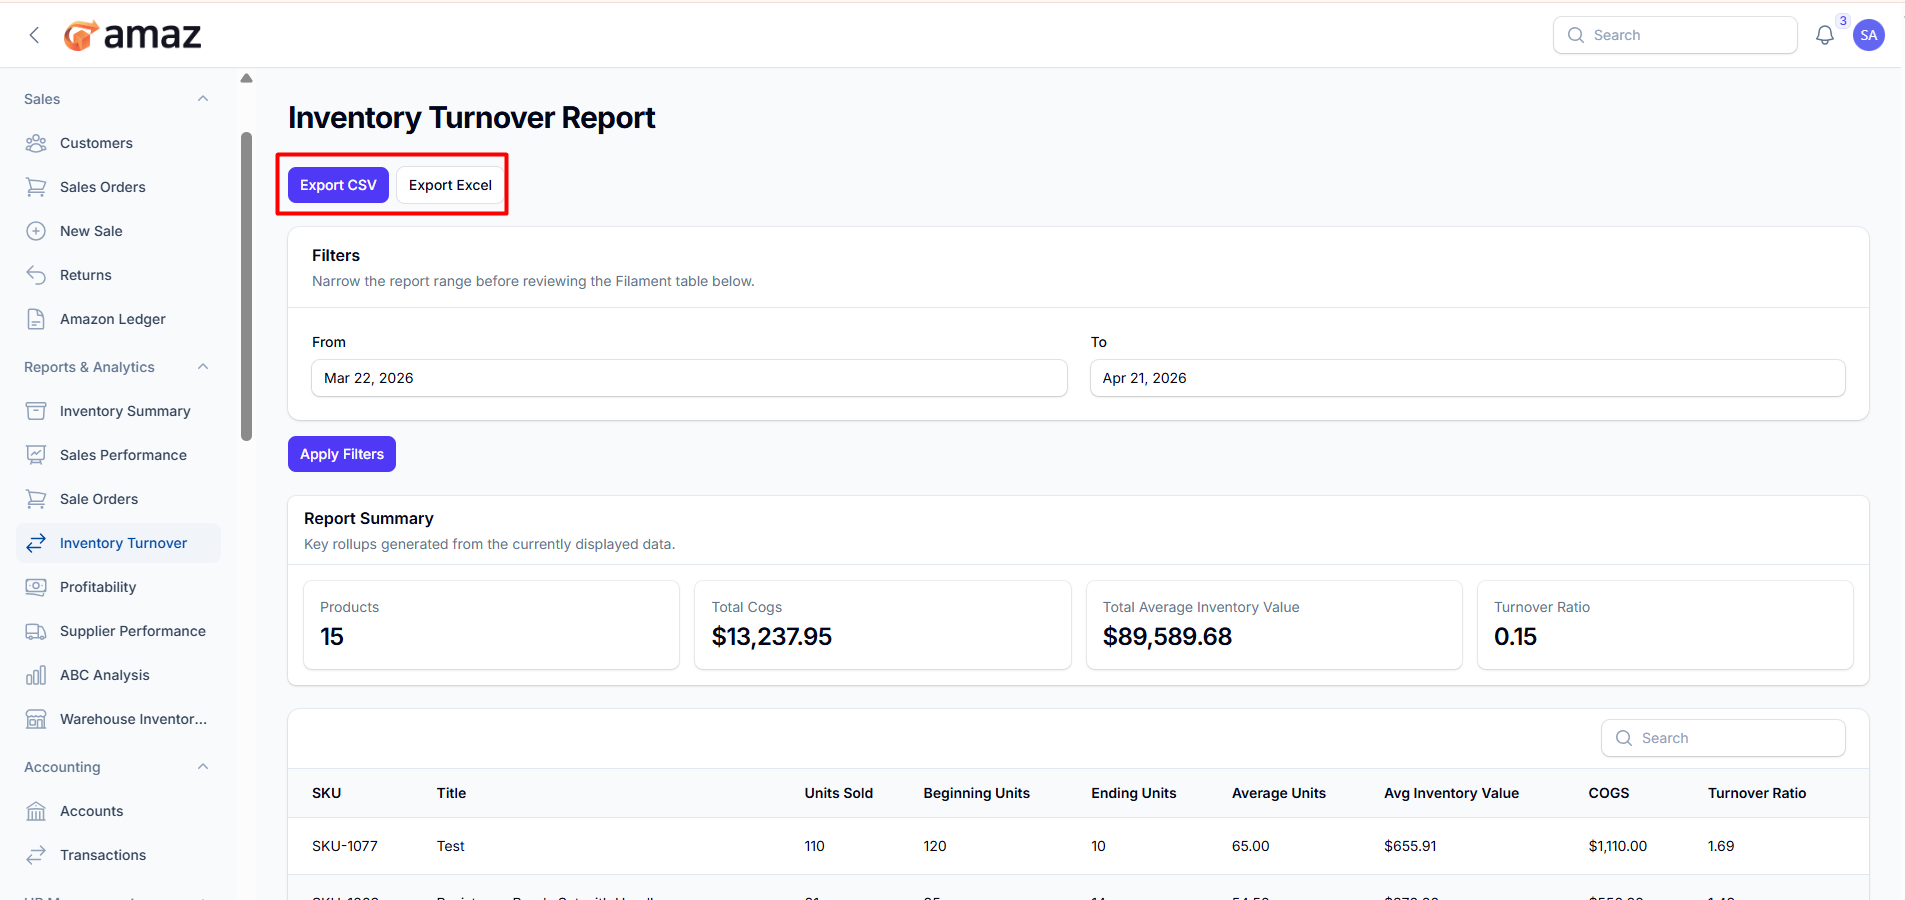
Filter – Description
From Date – View records starting from a specific date.
To Date – View records up to a specific date.
Use the search option to quickly find inventory turnover records by entering SKU or product title.