Profitability Report
Analyze profit margins by product.
Location: Reports & Analytics → Profitability
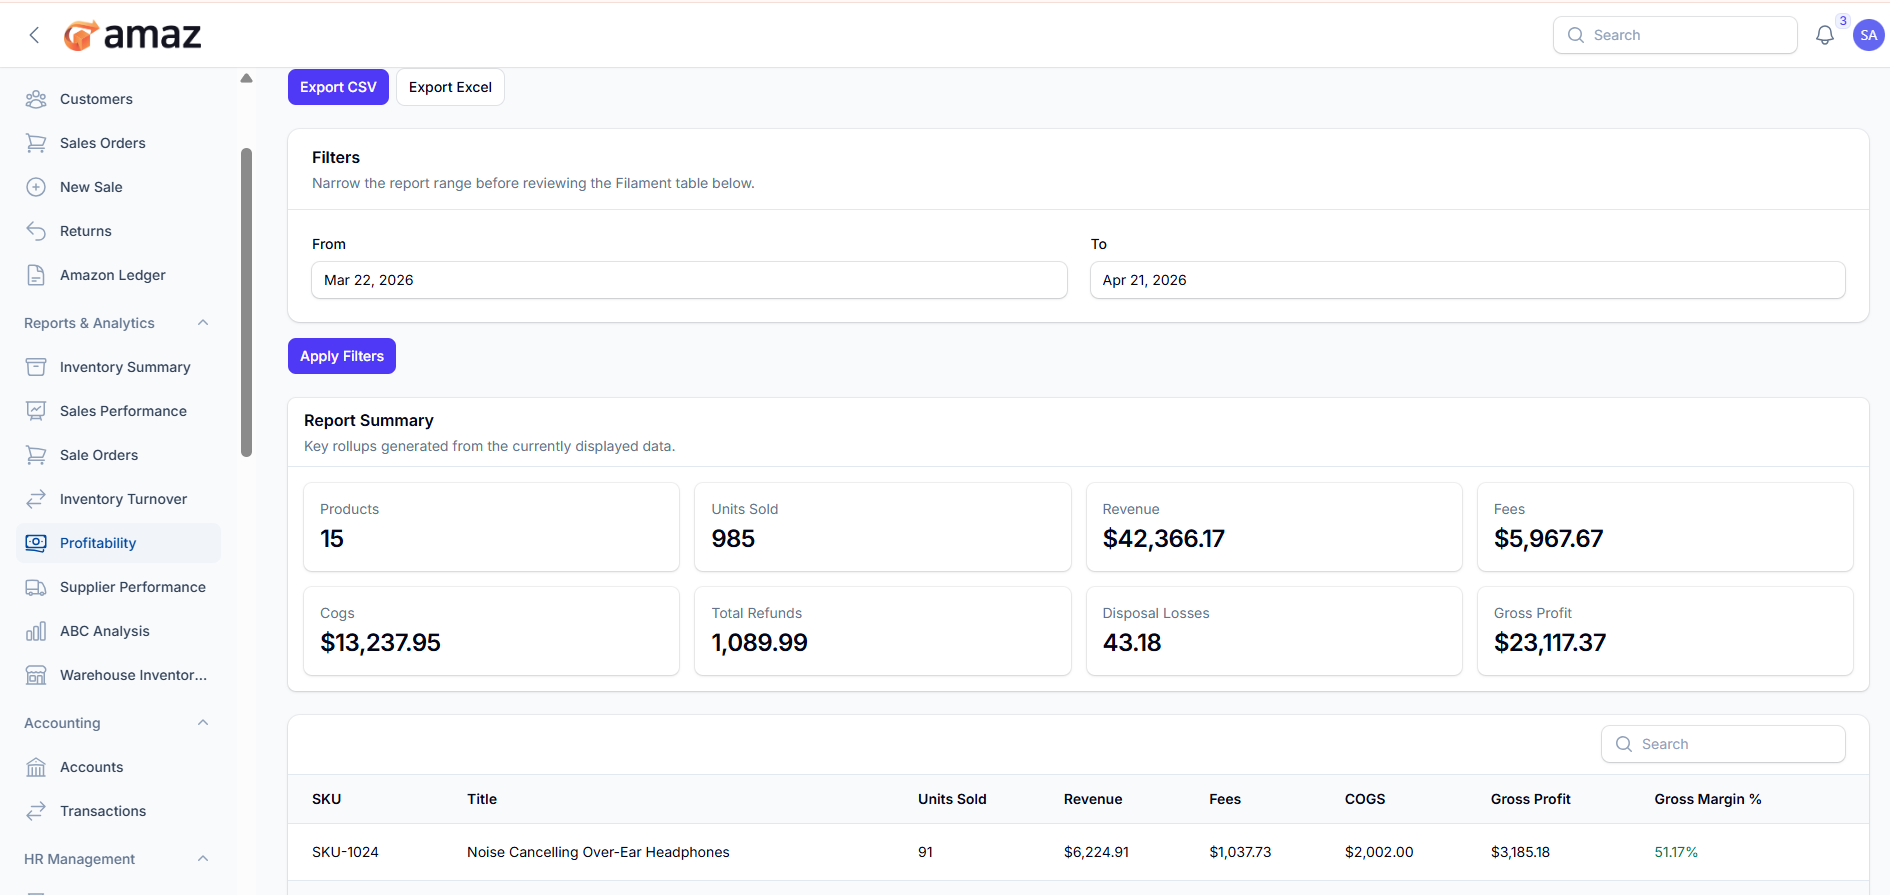
Profit Summary:
From here you can view the summary of profit performance.
Field – Description
Products – Total number of products included in the report.
Units Sold – Total quantity of items sold.
Revenue – Total sales revenue generated.
Fees – Total fees or charges applied.
COGS – Cost of goods sold.
Total Refunds – Total amount refunded to customers.
Disposal Losses – Losses from damaged or unsellable items.
Gross Profit – Profit before other expenses (Revenue − COGS − Fees − Refunds − Disposal Losses).
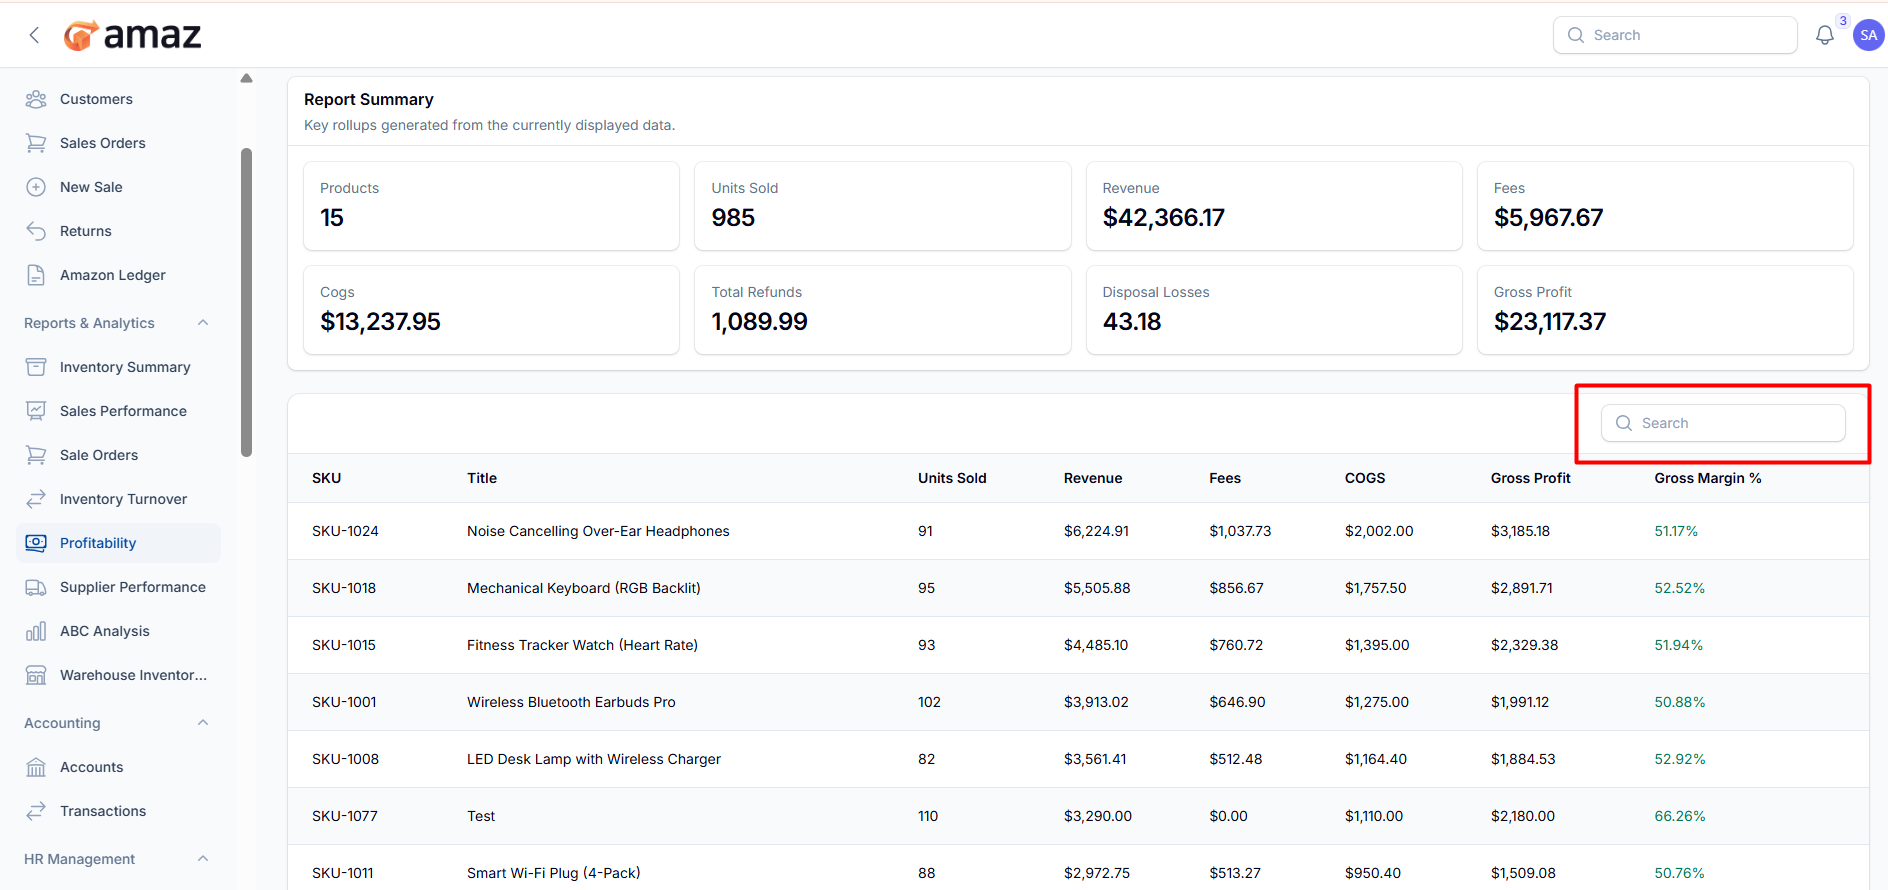
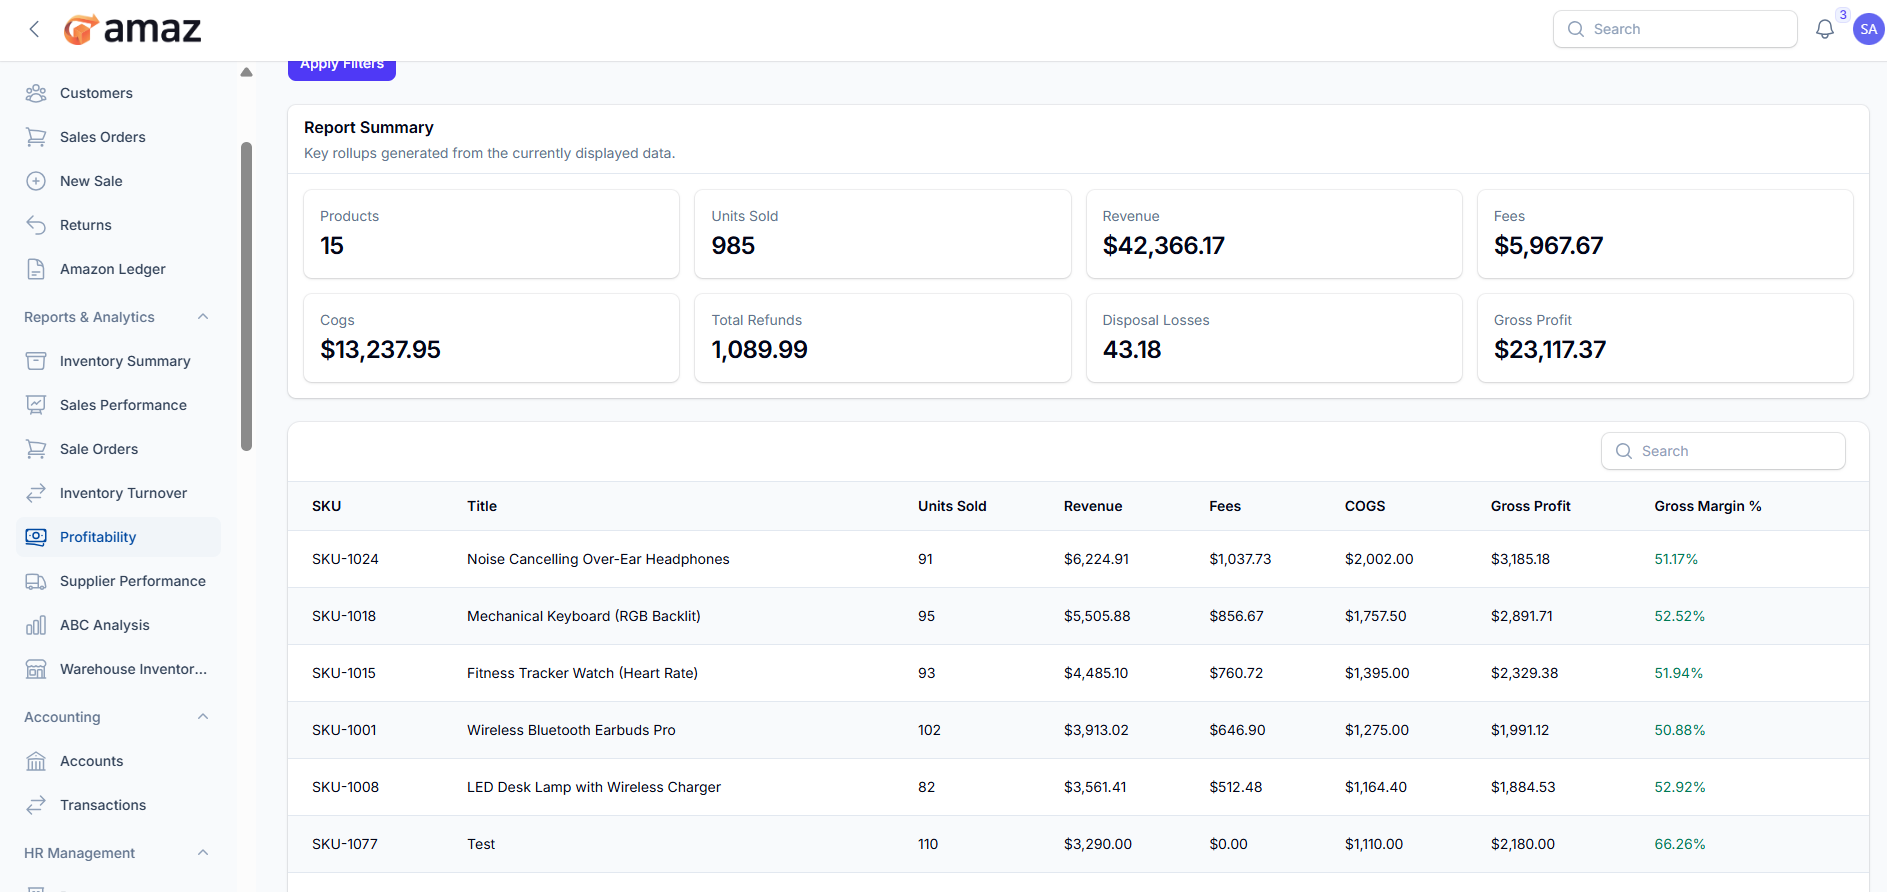
Profit Report List:
From here you can view the report entries along with detailed information.
Field – Description
SKU – Unique product SKU.
Title – Product name or title.
Units Sold – Total quantity sold.
Revenue – Total revenue generated.
Fees – Total fees or charges applied.
COGS – Cost of goods sold.
Gross Profit – Profit before other expenses (Revenue − COGS − Fees).
Gross Margin % – Percentage of profit relative to revenue.
Export CSV – Download the report in CSV format for easy data handling and integration.
Export Excel – Download the report in Excel format for detailed analysis and reporting.
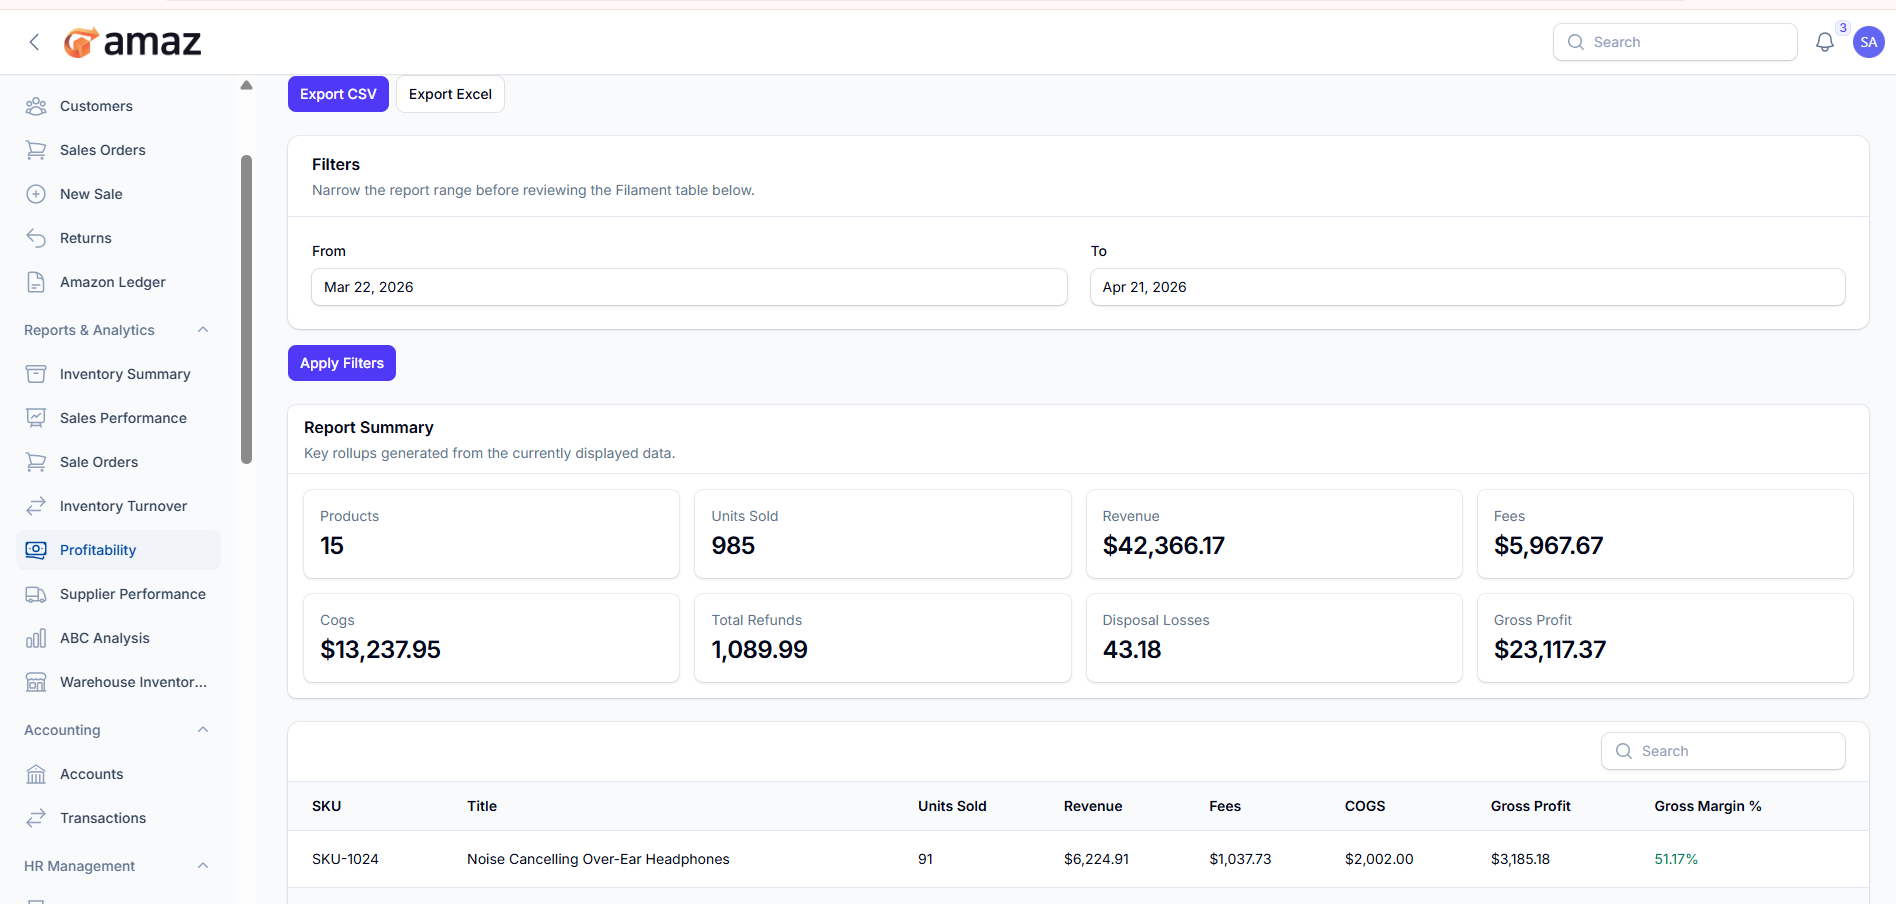
Filter – Description
From Date – View records starting from a specific date.
To Date – View records up to a specific date.