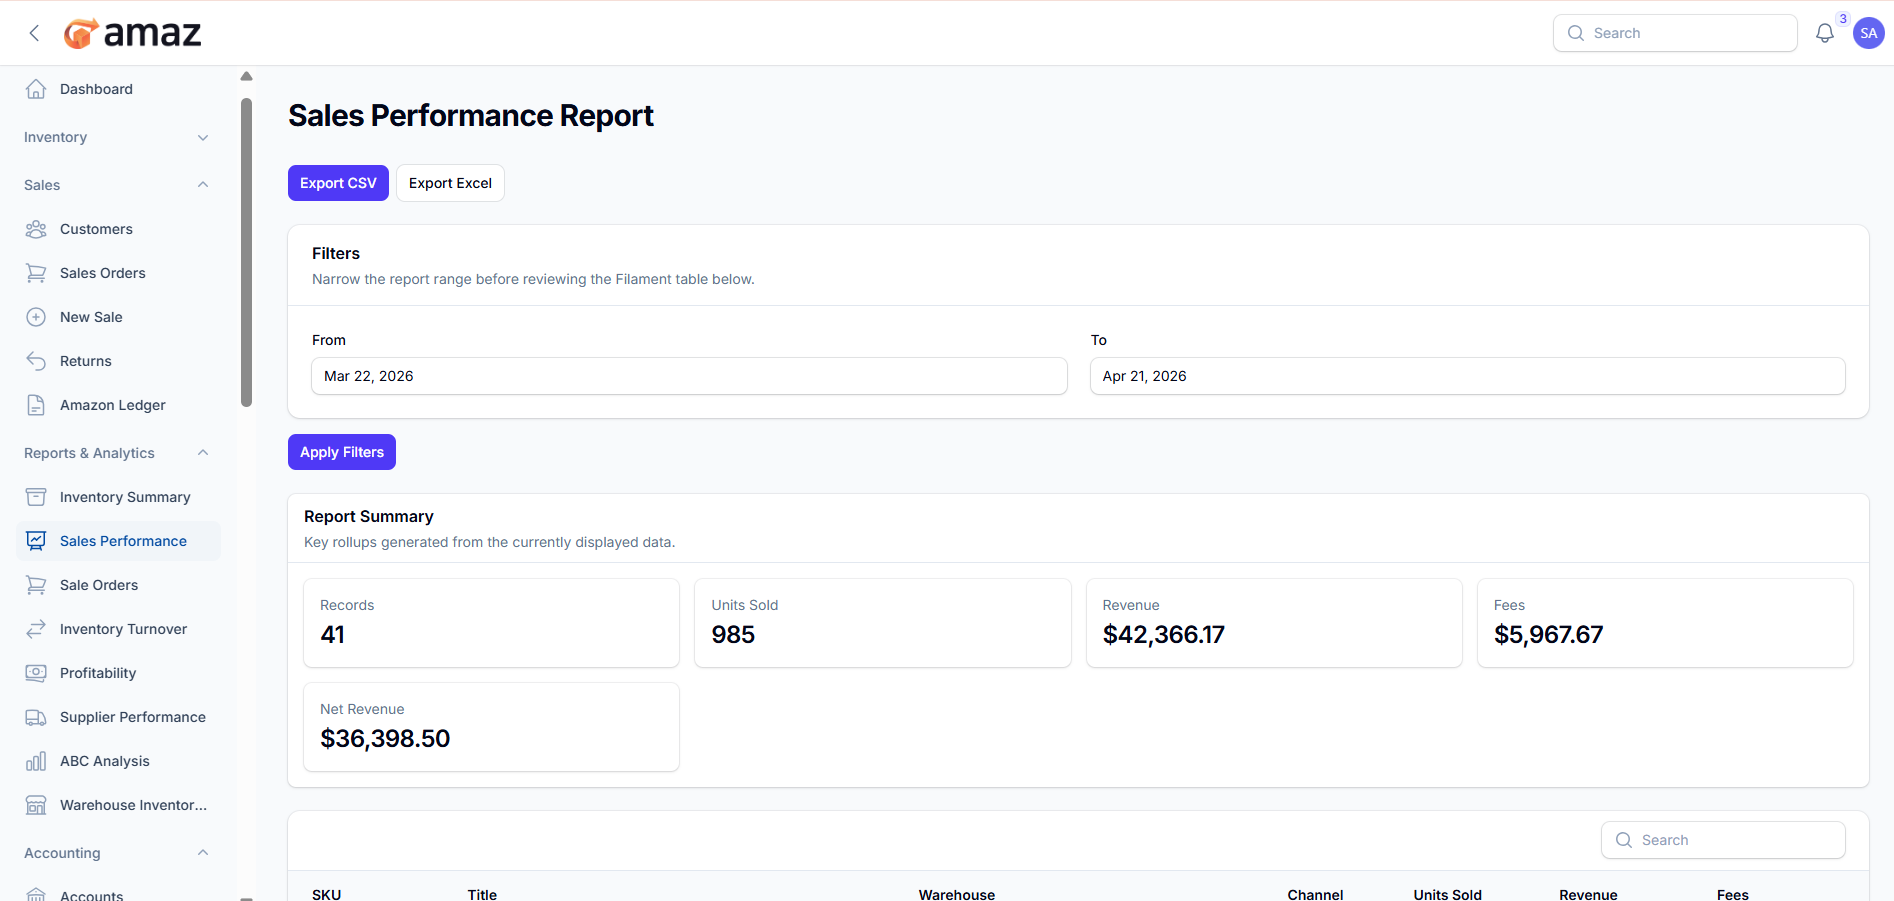
Sales Performance Report
Analyze sales trends and performance.
Location: Reports & Analytics → Sales Performance
Metrics:
- Total sales by period
- Sales by channel
- Sales by warehouse
- Revenue trends
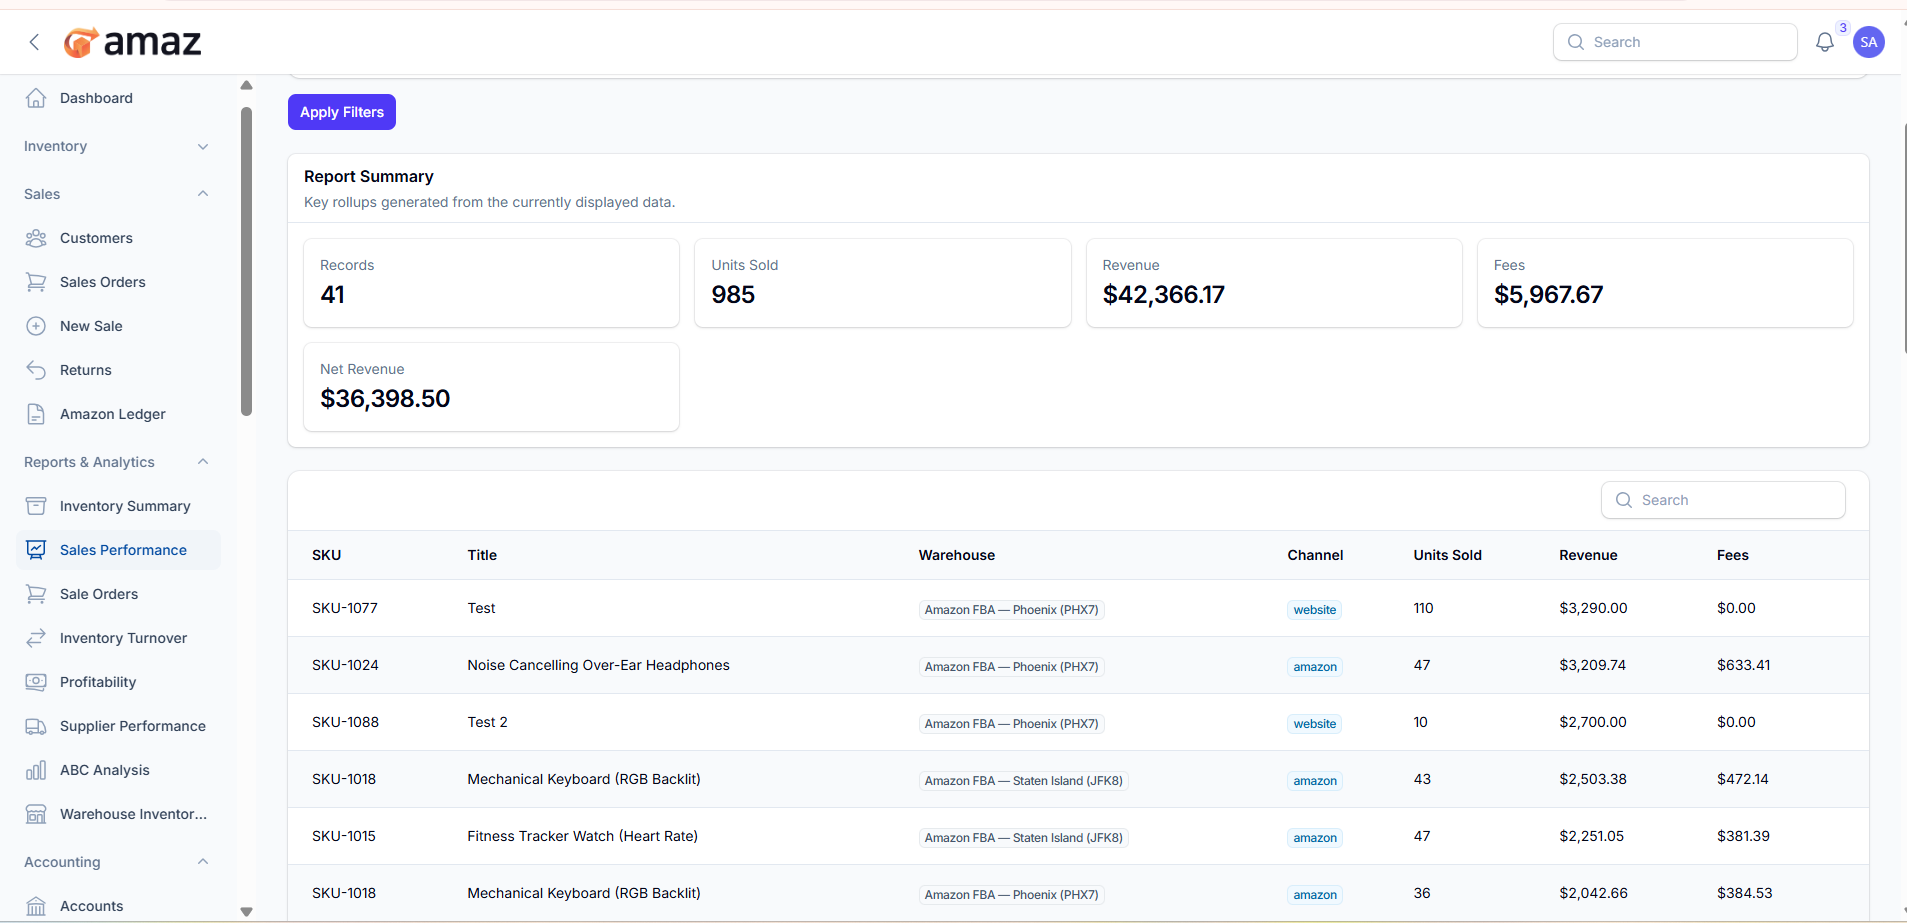
From here you can view the summary of the report.
Field – Description
Records – Total number of entries in the report.
Units Sold – Total quantity of items sold.
Revenue – Total sales revenue generated.
Fees – Total fees or charges applied (e.g., marketplace or transaction fees).
Net Revenue – Revenue after deducting all fees and charges.
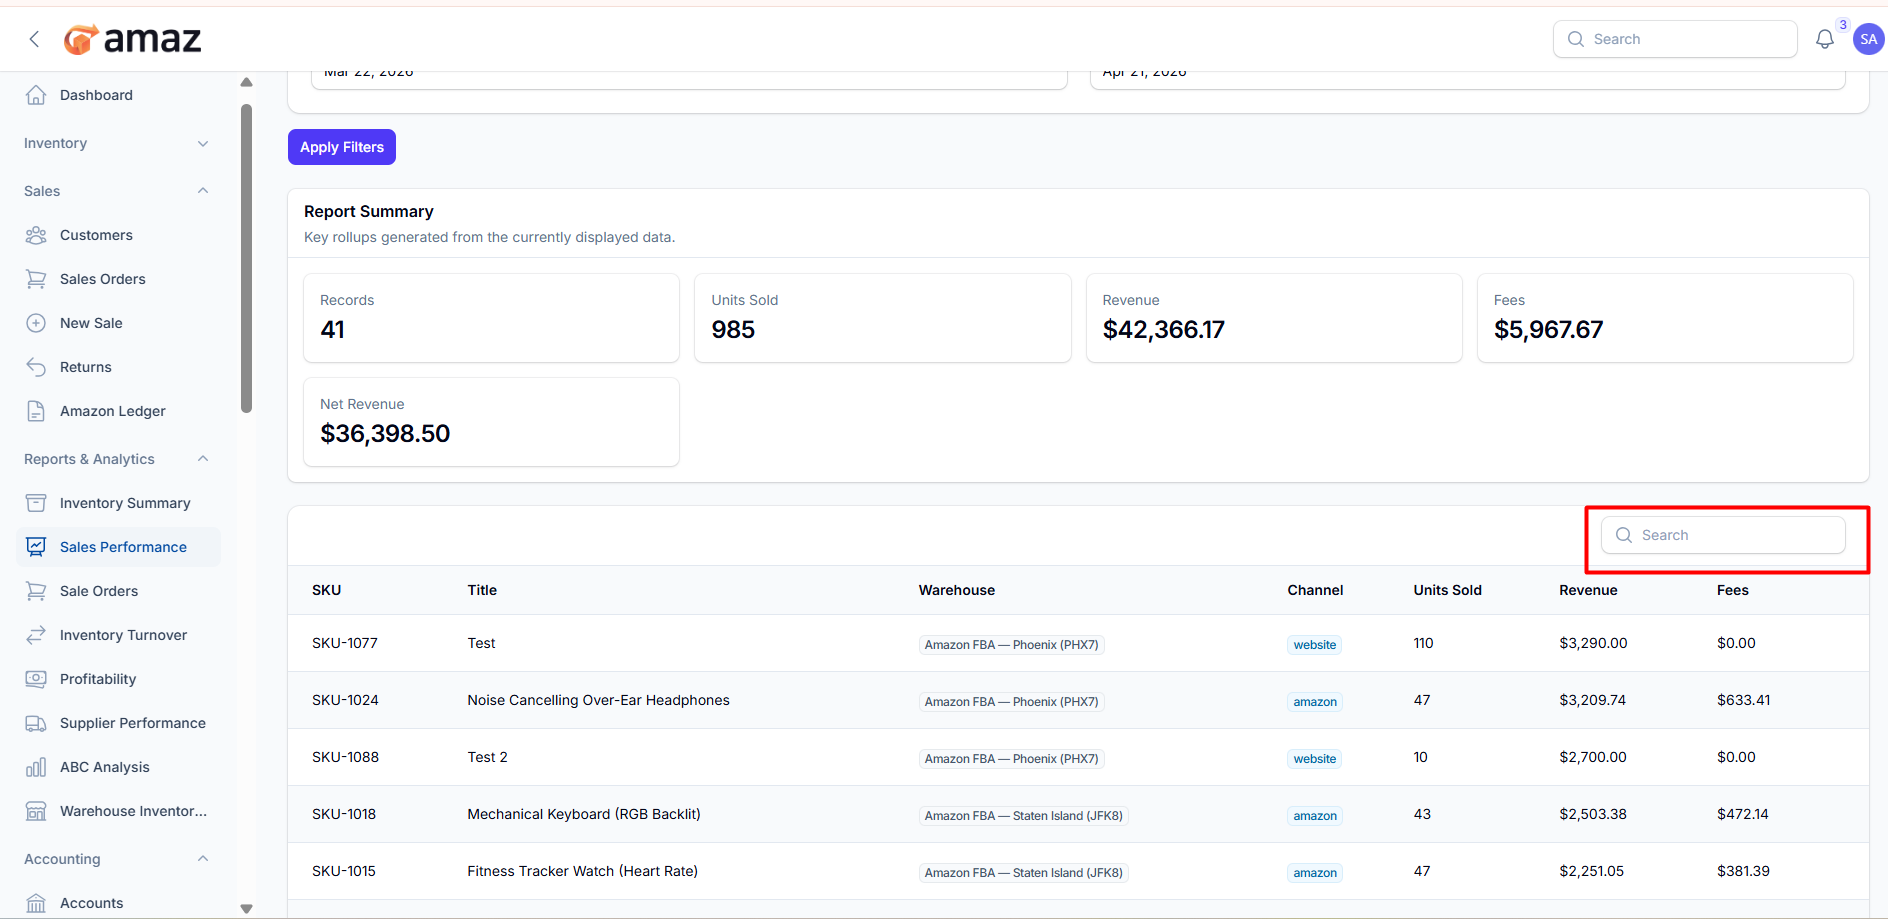
From here you can view the report entries along with detailed information.
Field – Description
SKU – Unique product SKU.
Title – Product name or title.
Warehouse – Warehouse location.
Channel – Sales channel (e.g., Direct, Website, Marketplace).
Units Sold – Total quantity sold.
Revenue – Total revenue generated.
Fees – Total fees applied to the sales.
Export CSV – Download the report in CSV format for easy data handling and integration.
Export Excel – Download the report in Excel format for detailed analysis and reporting.
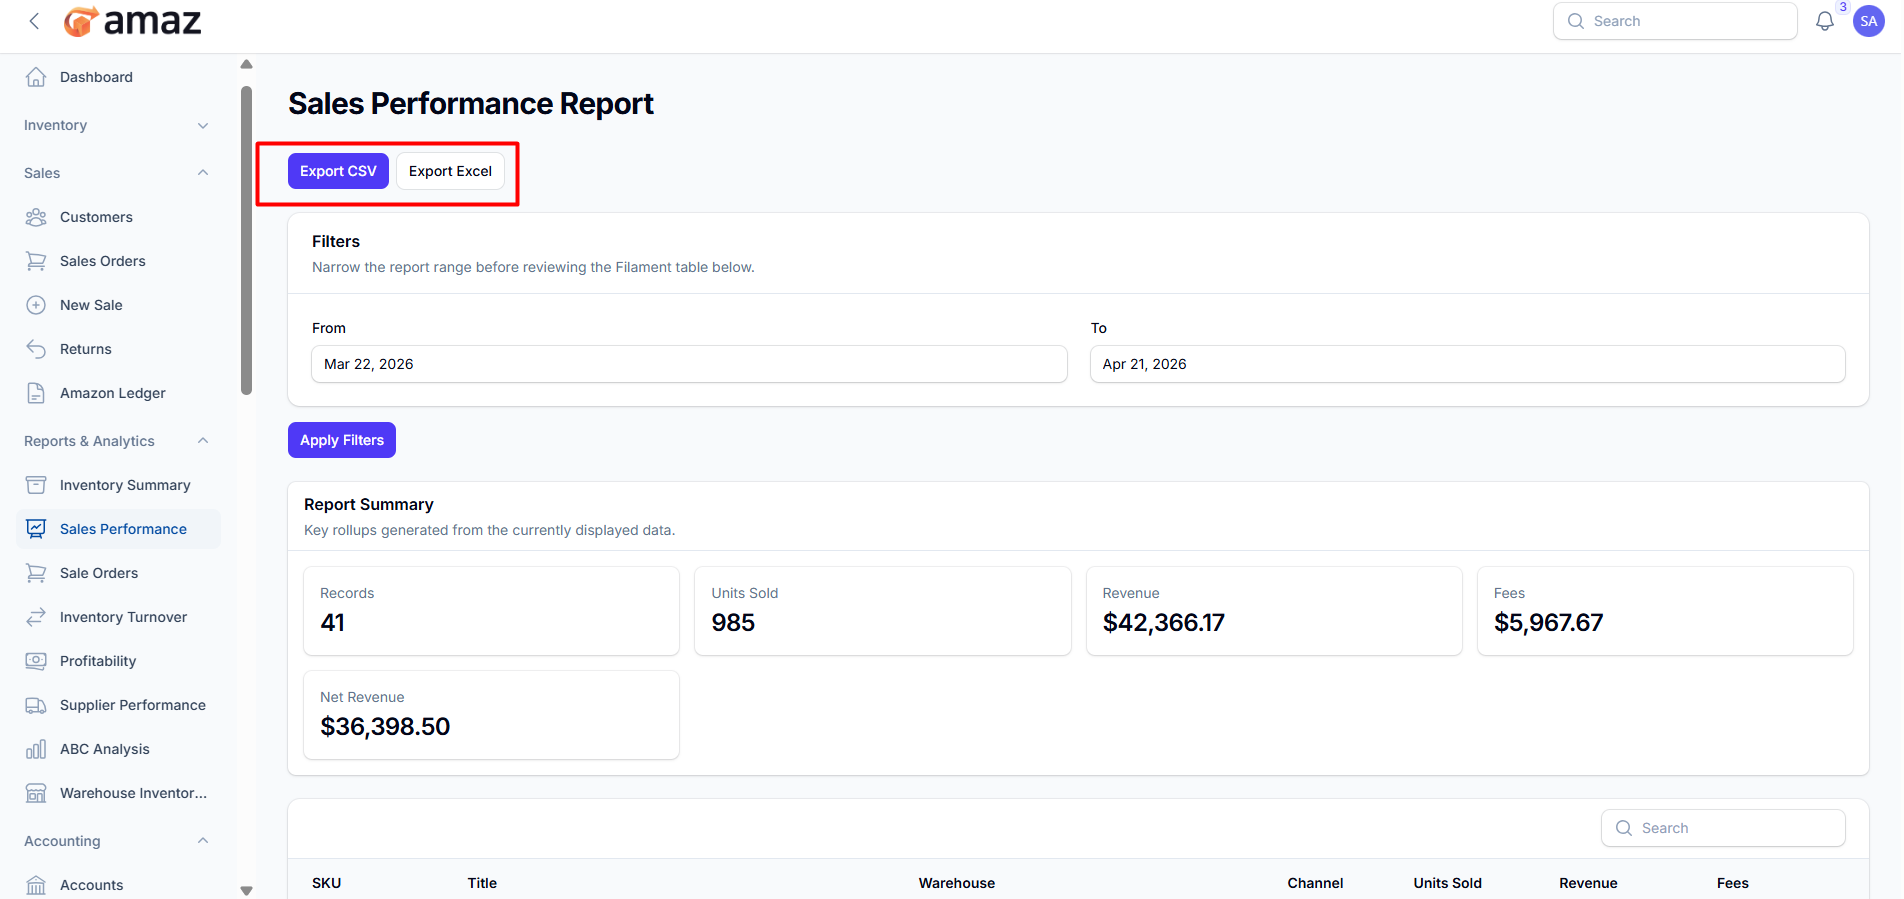
Filter – Description
From Date – View records starting from a specific date.
To Date – View records up to a specific date.
Use the search option to quickly find report records by entering details such as SKU, product title, or channel.