Dashboard
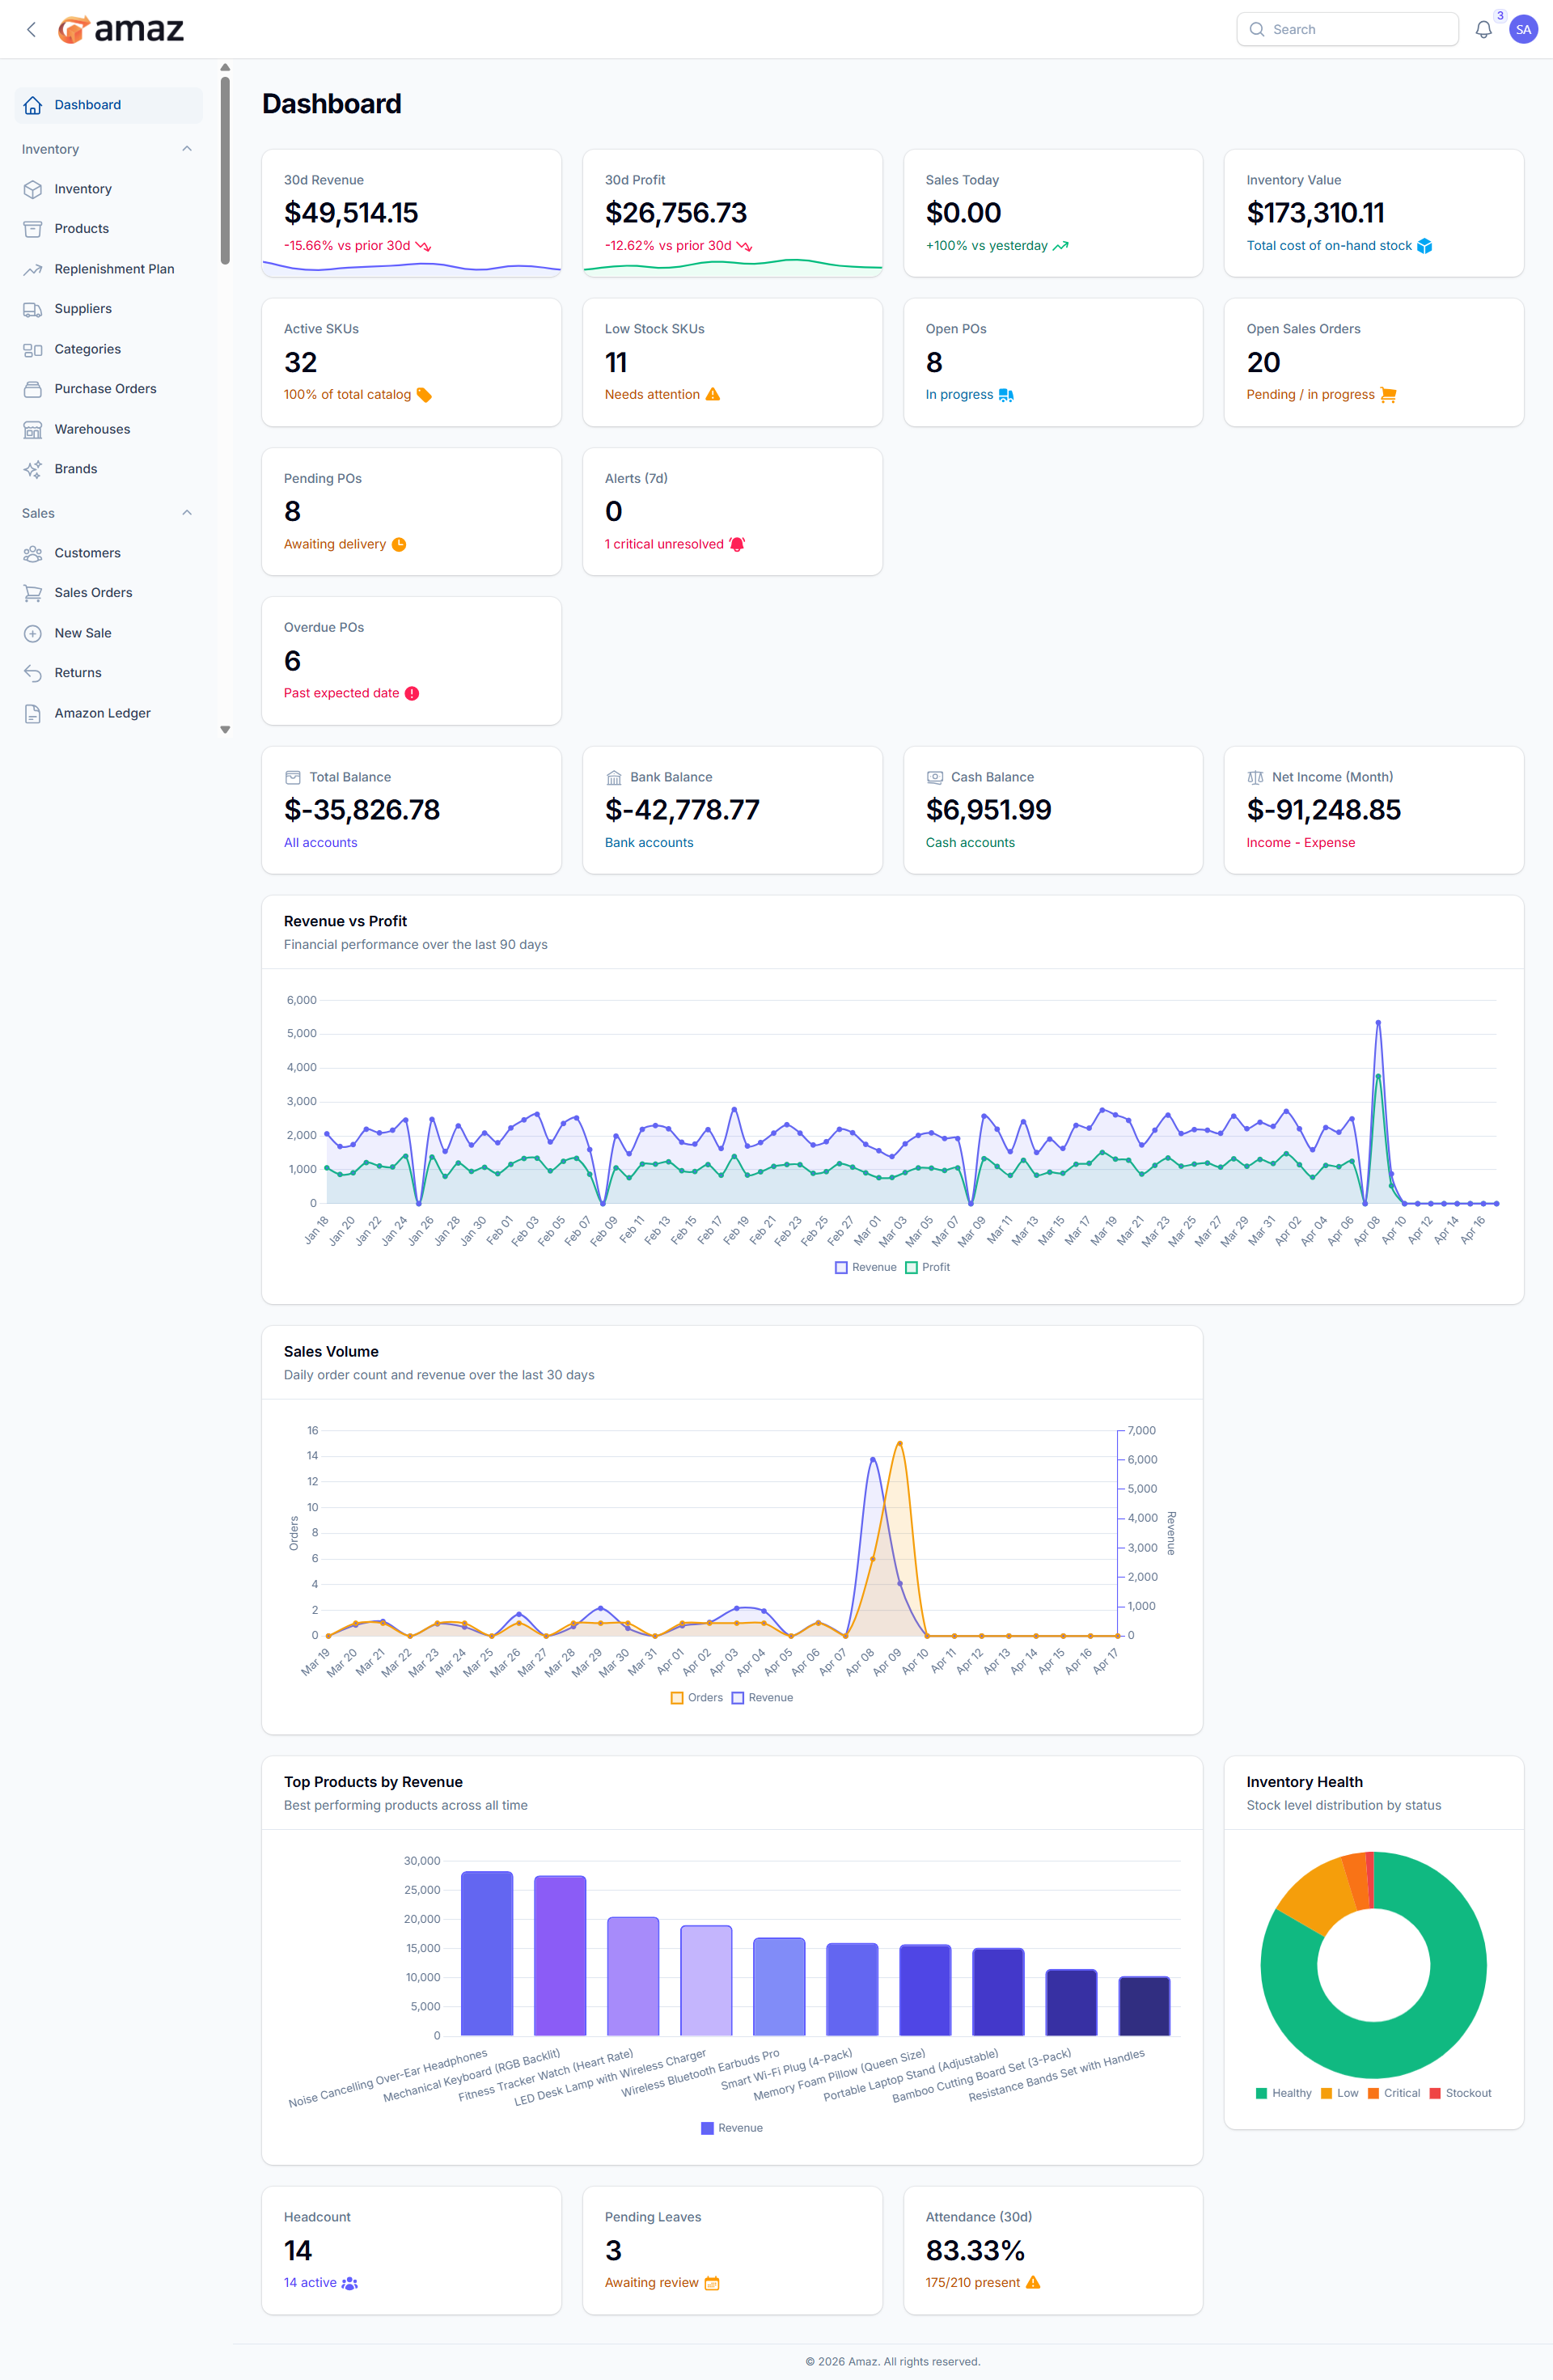
The Dashboard provides a real-time overview of your business performance.
Accessing the Dashboard
Click Dashboard in the sidebar (home icon). This is also the default page after login.
Dashboard Widgets
The dashboard displays the following information widgets:
Financial KPIs (Top Row):
Widget - Description
Revenue - Total revenue for the current period
Profit - Total profit for the current period
Sales Today - Number of sales made today
Inventory Value - Total monetary value of all stock
Operations Metrics:
Widget - Description
Active SKUs - Number of active products
Low Stock - Count of products below the reorder point
Open POs - Purchase orders awaiting delivery
Open Sales Orders - Sales orders being processed
Alerts Section:
Widget-Description
Pending POs - Purchase orders requiring attention.
Recent Alerts -Latest inventory and system alerts.
Overdue POS - Count of POS transactions that have passed their due date and remain unpaid or partially paid, requiring immediate attention.
Shows current balances of your financial accounts. Such as:
Total Balance – Combined balance across all financial accounts.
Bank Balance – Current balance available in all bank accounts.
Cash Balance – Cash on hand available for daily operations.
Net Income – Total income after deducting all expenses for the current period.
Charts:
Chart | Description
Revenue & Profit Chart - Visual trend of revenue and profit over time
Sales Volume Chart - Sales quantity trend visualization
Top Products - Best-selling products list
Inventory Health - Stock distribution and health indicators.
HR Section:
Widget | Description
Headcount - Total number of employees.
Pending Leave Requests - Leave requests awaiting approval.
Attendance Rate - Employee attendance percentage.
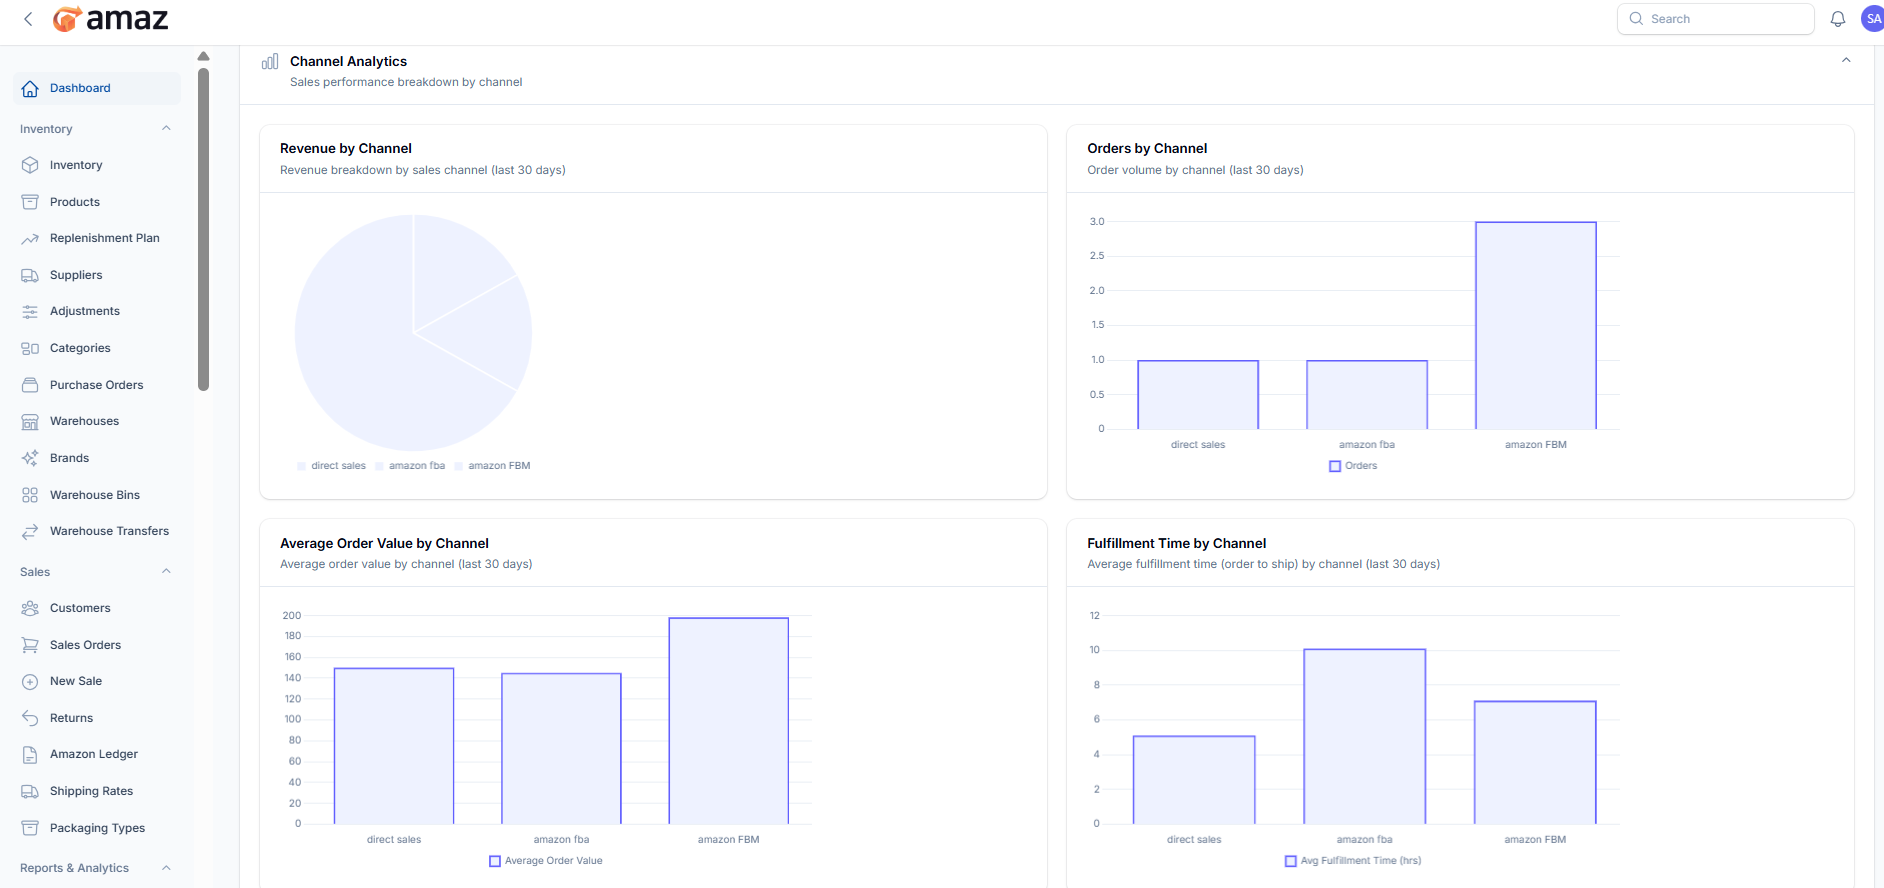
The Channel Analytics section provides a visual overview of sales performance across different sales channels. It helps users quickly understand trends, compare performance, and make data-driven decisions.
From this section, you can view the following metrics:
Revenue by Channel
Displays a visual breakdown of total revenue generated from each sales channel over the selected period.
Orders by Channel
Shows the number of orders received from each channel, helping you identify which channel drives the most sales volume.
Average Order Value by Channel
Represents the average value of orders per channel, allowing comparison of customer spending behavior.
Fulfillment Time by Channel
Illustrates the average time taken to fulfill orders (from order placement to shipment) for each channel.
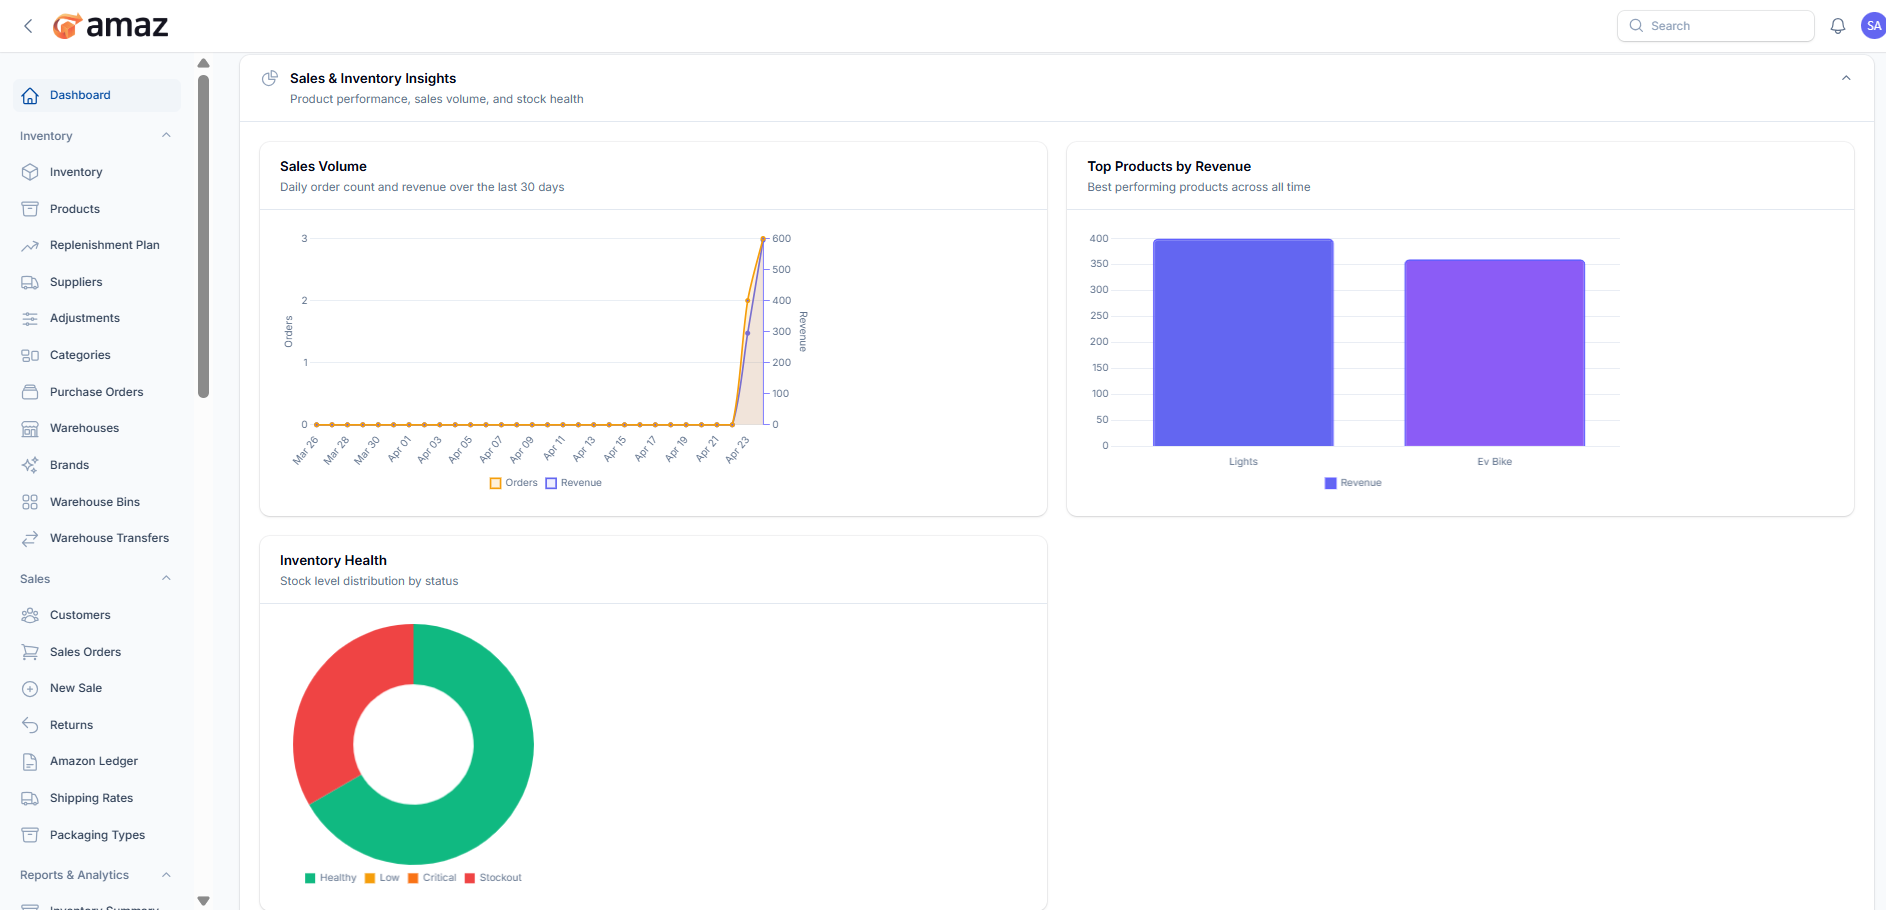
The Sales & Inventory Insights section provides a comprehensive visual overview of product performance, sales trends, and inventory status. It helps users monitor business health and make informed decisions.
Key Sections:Sales Volume
Displays daily order count and revenue over the last 30 days.
This chart helps track sales trends, identify peak days, and monitor revenue growth over time.
Top Products by Revenue
Shows the best-performing products based on total revenue.
This helps identify which products generate the most income and supports better inventory and marketing decisions.
Inventory Health
Provides a visual distribution of stock levels by status, such as:
Healthy
Low
Critical
Stockout
This chart helps quickly assess stock availability and identify items that need restocking.
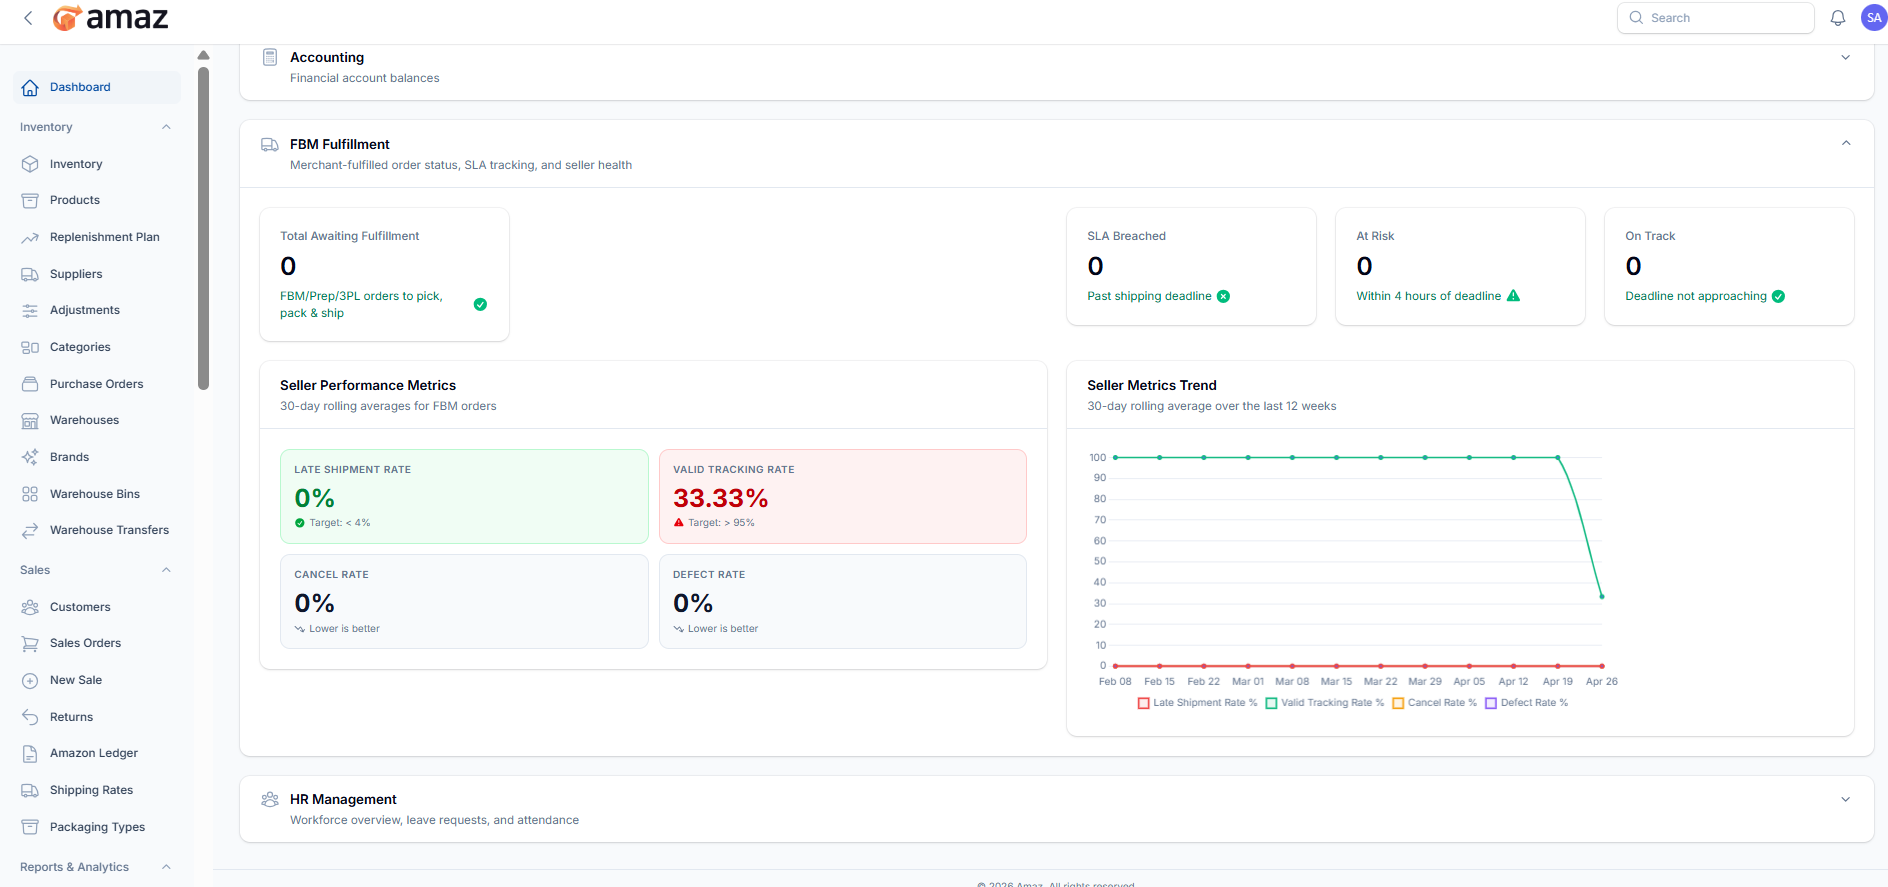
The FBM Fulfillment section provides insights into merchant-fulfilled orders, SLA (Service Level Agreement) tracking, and overall seller performance. It helps monitor order processing efficiency and compliance with shipping deadlines.
Overview Metrics:Total Awaiting Fulfillment
Displays the number of orders that are pending fulfillment (pick, pack, and ship).
Includes FBM, Prep, and 3PL orders.
SLA Breached
Indicates the number of orders that have passed the shipping deadline.
At Risk
Shows orders that are close to missing the SLA deadline (e.g., within a few hours).
On Track
Represents orders that are within the safe processing time and not at risk.
Provides key performance indicators based on a 30-day rolling average:
Late Shipment Rate
Percentage of orders shipped позд after the expected date.
Target: Less than 4%.
Valid Tracking Rate
Percentage of orders with valid tracking information.
Target: Greater than 95%.
Cancel Rate
Percentage of canceled orders.
Lower values indicate better performance.
Defect Rate
Measures issues such as negative feedback, claims, or chargebacks.
Lower values indicate better seller reliability.
Displays a trend chart of performance metrics over the last 12 weeks.
Helps track improvements or declines in:
Late Shipment Rate
Valid Tracking Rate
Cancel Rate
Defect Rate
This enables better monitoring of long-term seller performance and SLA compliance.